Zurück

Grundlegende Kurven-Kapnographie als Hilfsmittel für die kontinuierliche Überwachung während der maschinellen Beatmung

Artikel

Autor: Joe Hylton, MA, BSRT, RRT-ACCS/NPS, NRP, FAARC, FCCM, Clinical Applications Specialist, Hamilton Medical Inc.

Datum: 15.07.2021

Die Kurven-Kapnographie ist in der Intensivmedizin und -pflege etabliert. Sie wird als Hilfsmittel zur Validierung der Atemwegssicherung häufig in der bewussten Sedierung eingesetzt sowie beim innerklinischen Transport von intubierten Patienten, die eine maschinelle Beatmung benötigen.  Die Kurven-Kapnographie kann dem gut ausgebildeten Pflegepersonal zeitnah wichtige Informationen liefern.

Grundlegende Kurven-Kapnographie als Hilfsmittel für die kontinuierliche Überwachung während der maschinellen Beatmung

Physiologische Faktoren, die sich auf den endtidalen Kohlendioxidgehalt (PetCO2) auswirken

Viele Faktoren können eine Auswirkung auf den Anteil an Kohlendioxid im endtidalen Gas (PetCO2) haben. Die CO2-Eliminierung ist ein fein abgestimmter, kontinuierlicher Prozess von der CO2-Produktion im Gewebe über den Transport im Blut und die Diffusion in die Alveolen bis hin zur Eliminierung durch die Beatmung (Kremeier P, Böhm SH, Tusman G. Clinical use of volumetric capnography in mechanically ventilated patients. J Clin Monit Comput. 2020;34(1):7-16. doi:10.1007/s10877-019-00325-91​). Mit der grafischen Darstellung des ausgeatmeten CO2 stellt die Kapnographie ein nichtinvasives Mittel dar, mit dem in Echtzeit Informationen über die CO2-Kinetik bei maschinell beatmeten Patienten angezeigt werden können.

Ein Ansteigen oder Abfallen der metabolischen Rate des Patienten führt zu einer Veränderung in der CO2-Produktion und somit auch in der CO2-Eliminierung. Wenn die Durchblutung und Beatmung stabil sind, was nur bei einem passiven, maschinell beatmeten Patienten der Fall ist, kann das CO2-Monitoring als Indikator für die CO2-Produktion verwendet werden. Fieber, Sepsis, Schmerzen und Krämpfe sind Zustände, die den Metabolismus beschleunigen und zu einem entsprechenden Anstieg in der CO2-Produktion und in Folge des PetCO2 führen. Bei unterkühlten, sedierten oder gelähmten Patienten kommt es zu einer Verlangsamung des Metabolismus. Dies führt zu einer reduzierten CO2-Produktion und möglicherweise zu einer Verringerung des PetCO2, wenn das Minutenvolumen nicht gleichzeitig erhöht wird (Gravenstein, J., Jaffe, M., & Paulus, D. (2004). Capnography: Clinical Aspects. New York: Cambridge University Press.2​).

Der Transport des CO2 zur Lunge hängt von einer angemessenen Herz-/Kreislauffunktion ab; somit kann jeder Faktor, der die Herz-/Kreislauffunktion verändert, auch Auswirkungen auf den Transport des CO2 zur Lunge haben (Gravenstein, J., Jaffe, M., & Paulus, D. (2004). Capnography: Clinical Aspects. New York: Cambridge University Press.2​).

Die CO2-Abatmung aus der Lunge in die Umgebung wird von Veränderungen in der Atemfunktion beeinflusst. Obstruktive Lungenerkrankungen, Pneumonie, neuromuskuläre Störungen und Störungen des zentralen Nervensystems, die zu einer Beeinträchtigung der Atemfunktion führen, wirken sich somit auch auf den PetCO2-Wert aus (Gravenstein, J., Jaffe, M., & Paulus, D. (2004). Capnography: Clinical Aspects. New York: Cambridge University Press.2​).

Arten der Kapnographie

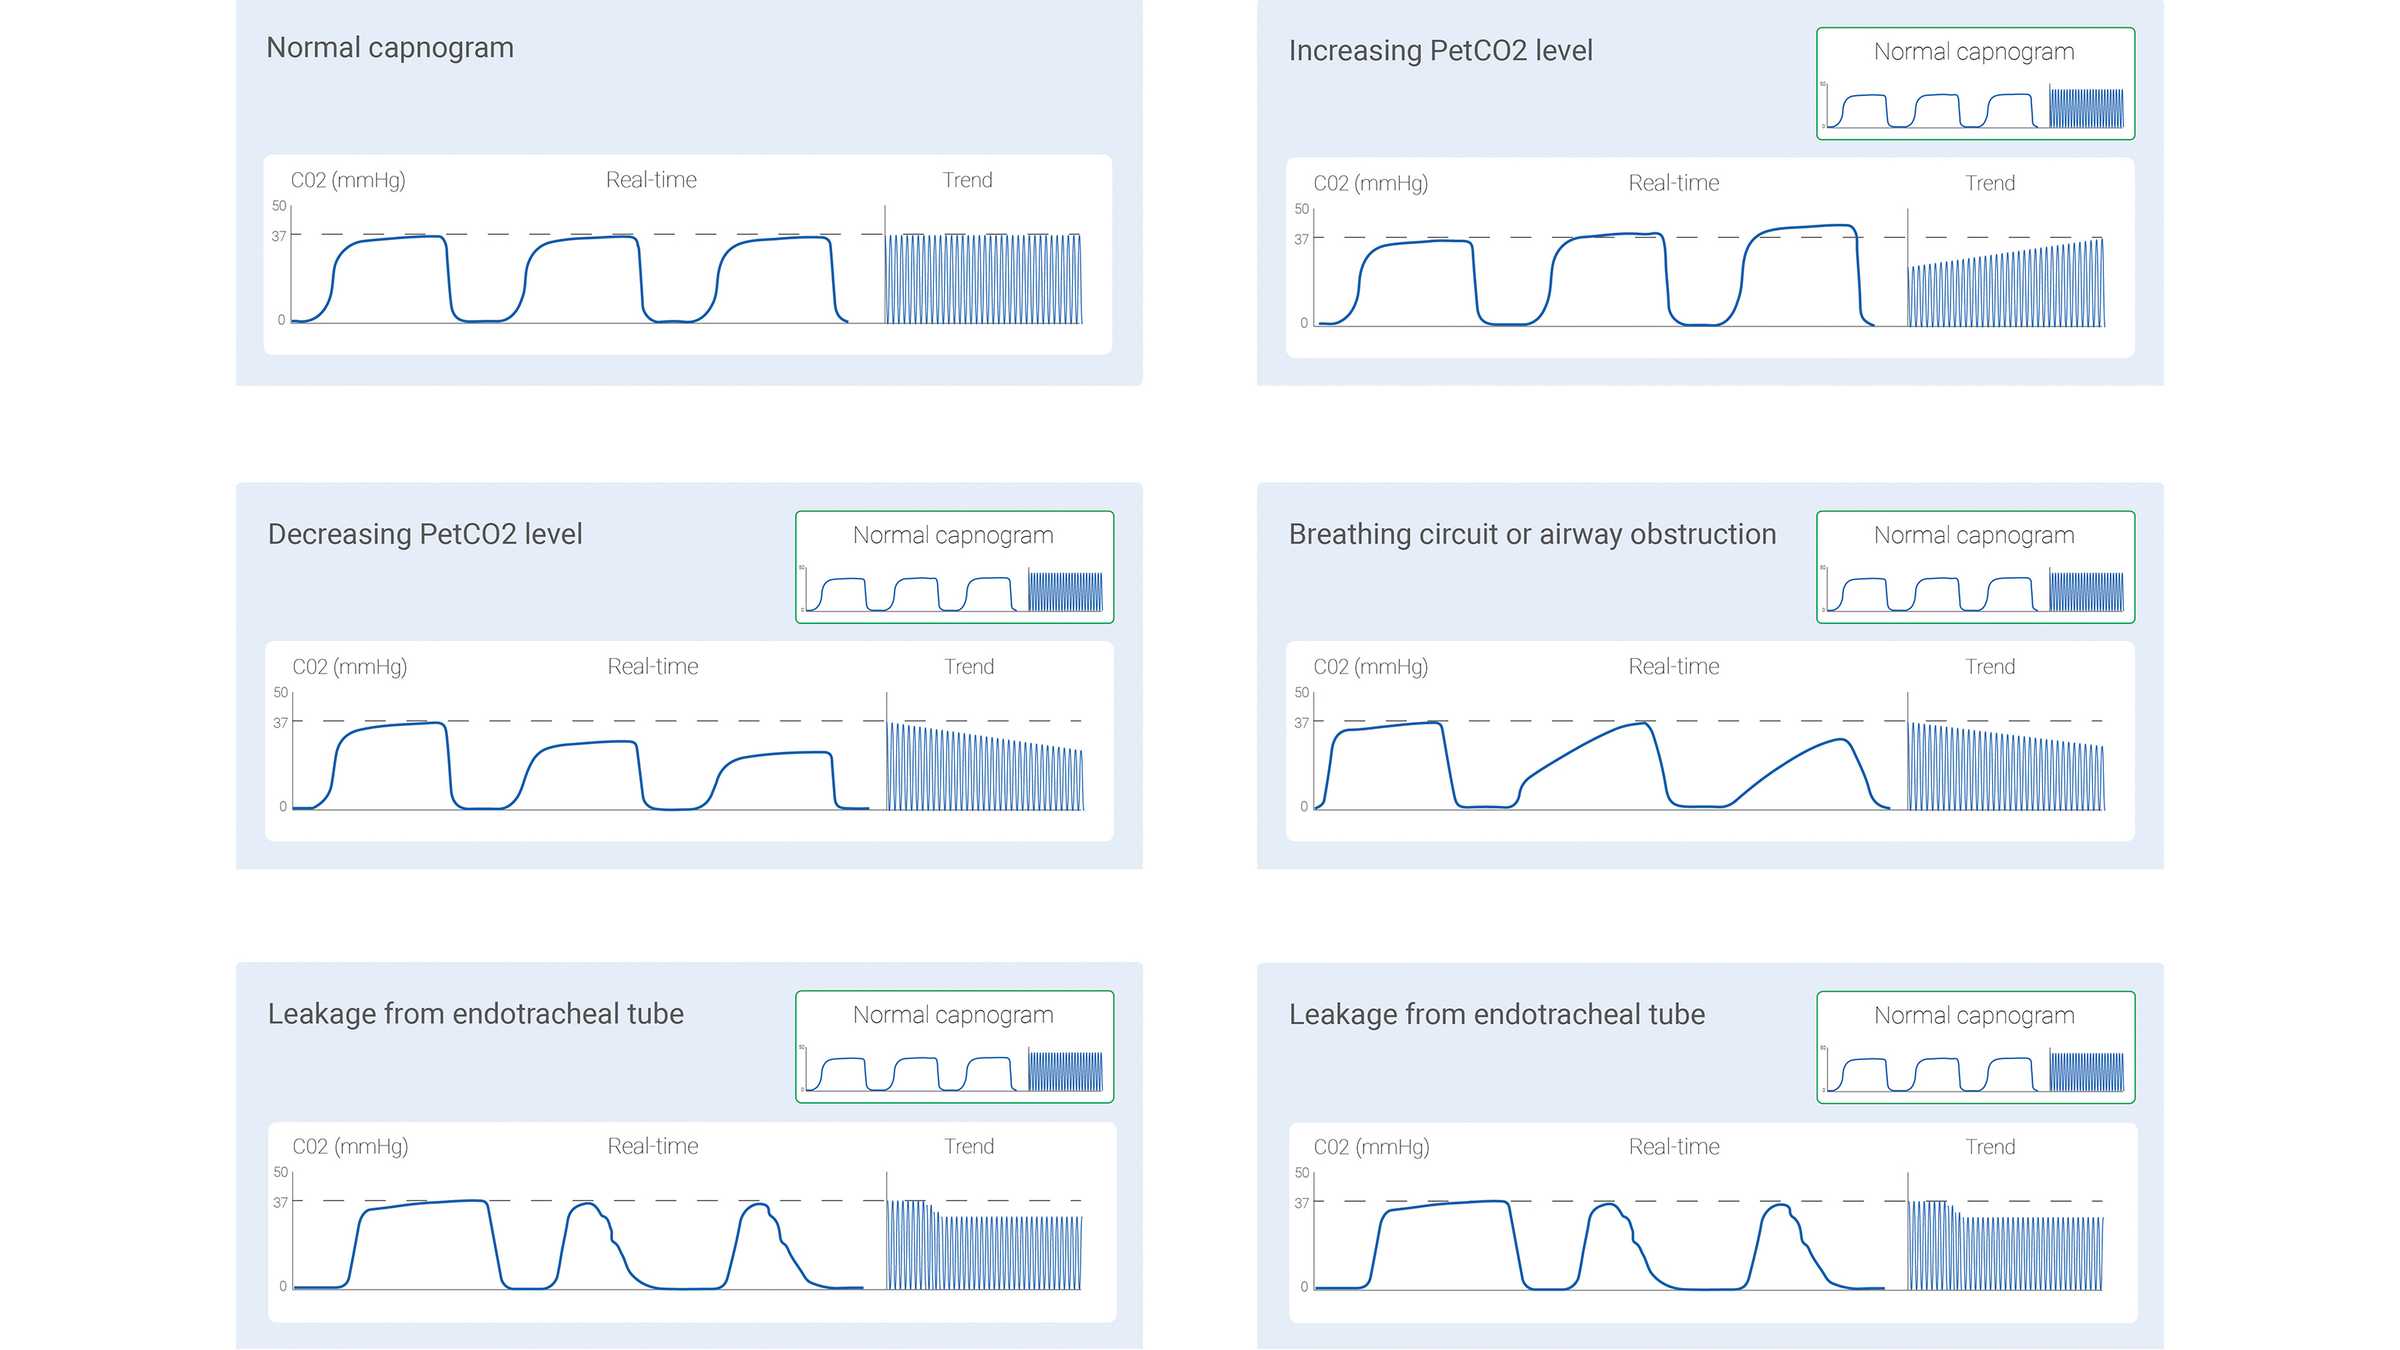
Das gemessene CO2-Signal kann als Funktion der Zeit (zeitbasierte Kapnographie) oder des Exspirationsvolumens (volumetrische Kapnographie) aufgezeichnet werden. Die Menge an verfügbaren Informationen variiert je nach der unterschiedlichen Kapnographieart stark. In der Literatur werden bestimmte Muster in einem zeitbasierten Kapnogramm beschrieben, die als typisch für eine spezielle klinische Situation gelten. Eine Auswahl der häufigsten Muster ist in der Abbildung 1 unten dargestellt.

Die zeitbasierte Kapnographie hat jedoch auch Beschränkungen: Sie kann keine genaue Einschätzung des Ventilations-Perfusions-Verhältnisses der Lunge abgeben, und sie kann auch nicht zur Beurteilung der Komponente des physiologischen Totraums verwendet werden. Die volumetrische Kapnographie ist nicht so einfach und praktisch wie die zeitbasierte Kapnographie, bietet aber deutlich mehr Informationen an.
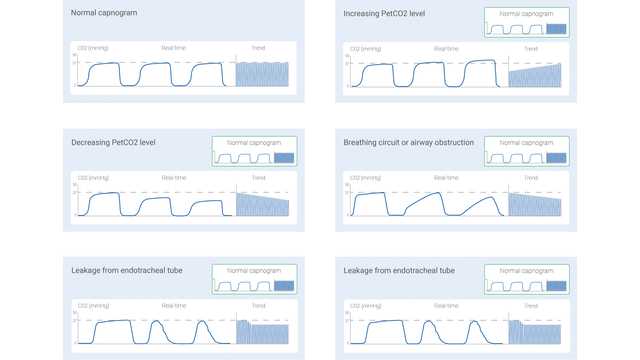
Schematische Darstellungen von Kapnogrammen für häufige Zustände
Abbildung 1
Schematische Darstellungen von Kapnogrammen für häufige Zustände
Abbildung 1

Das volumetrische Kapnogramm – Form und Phasen

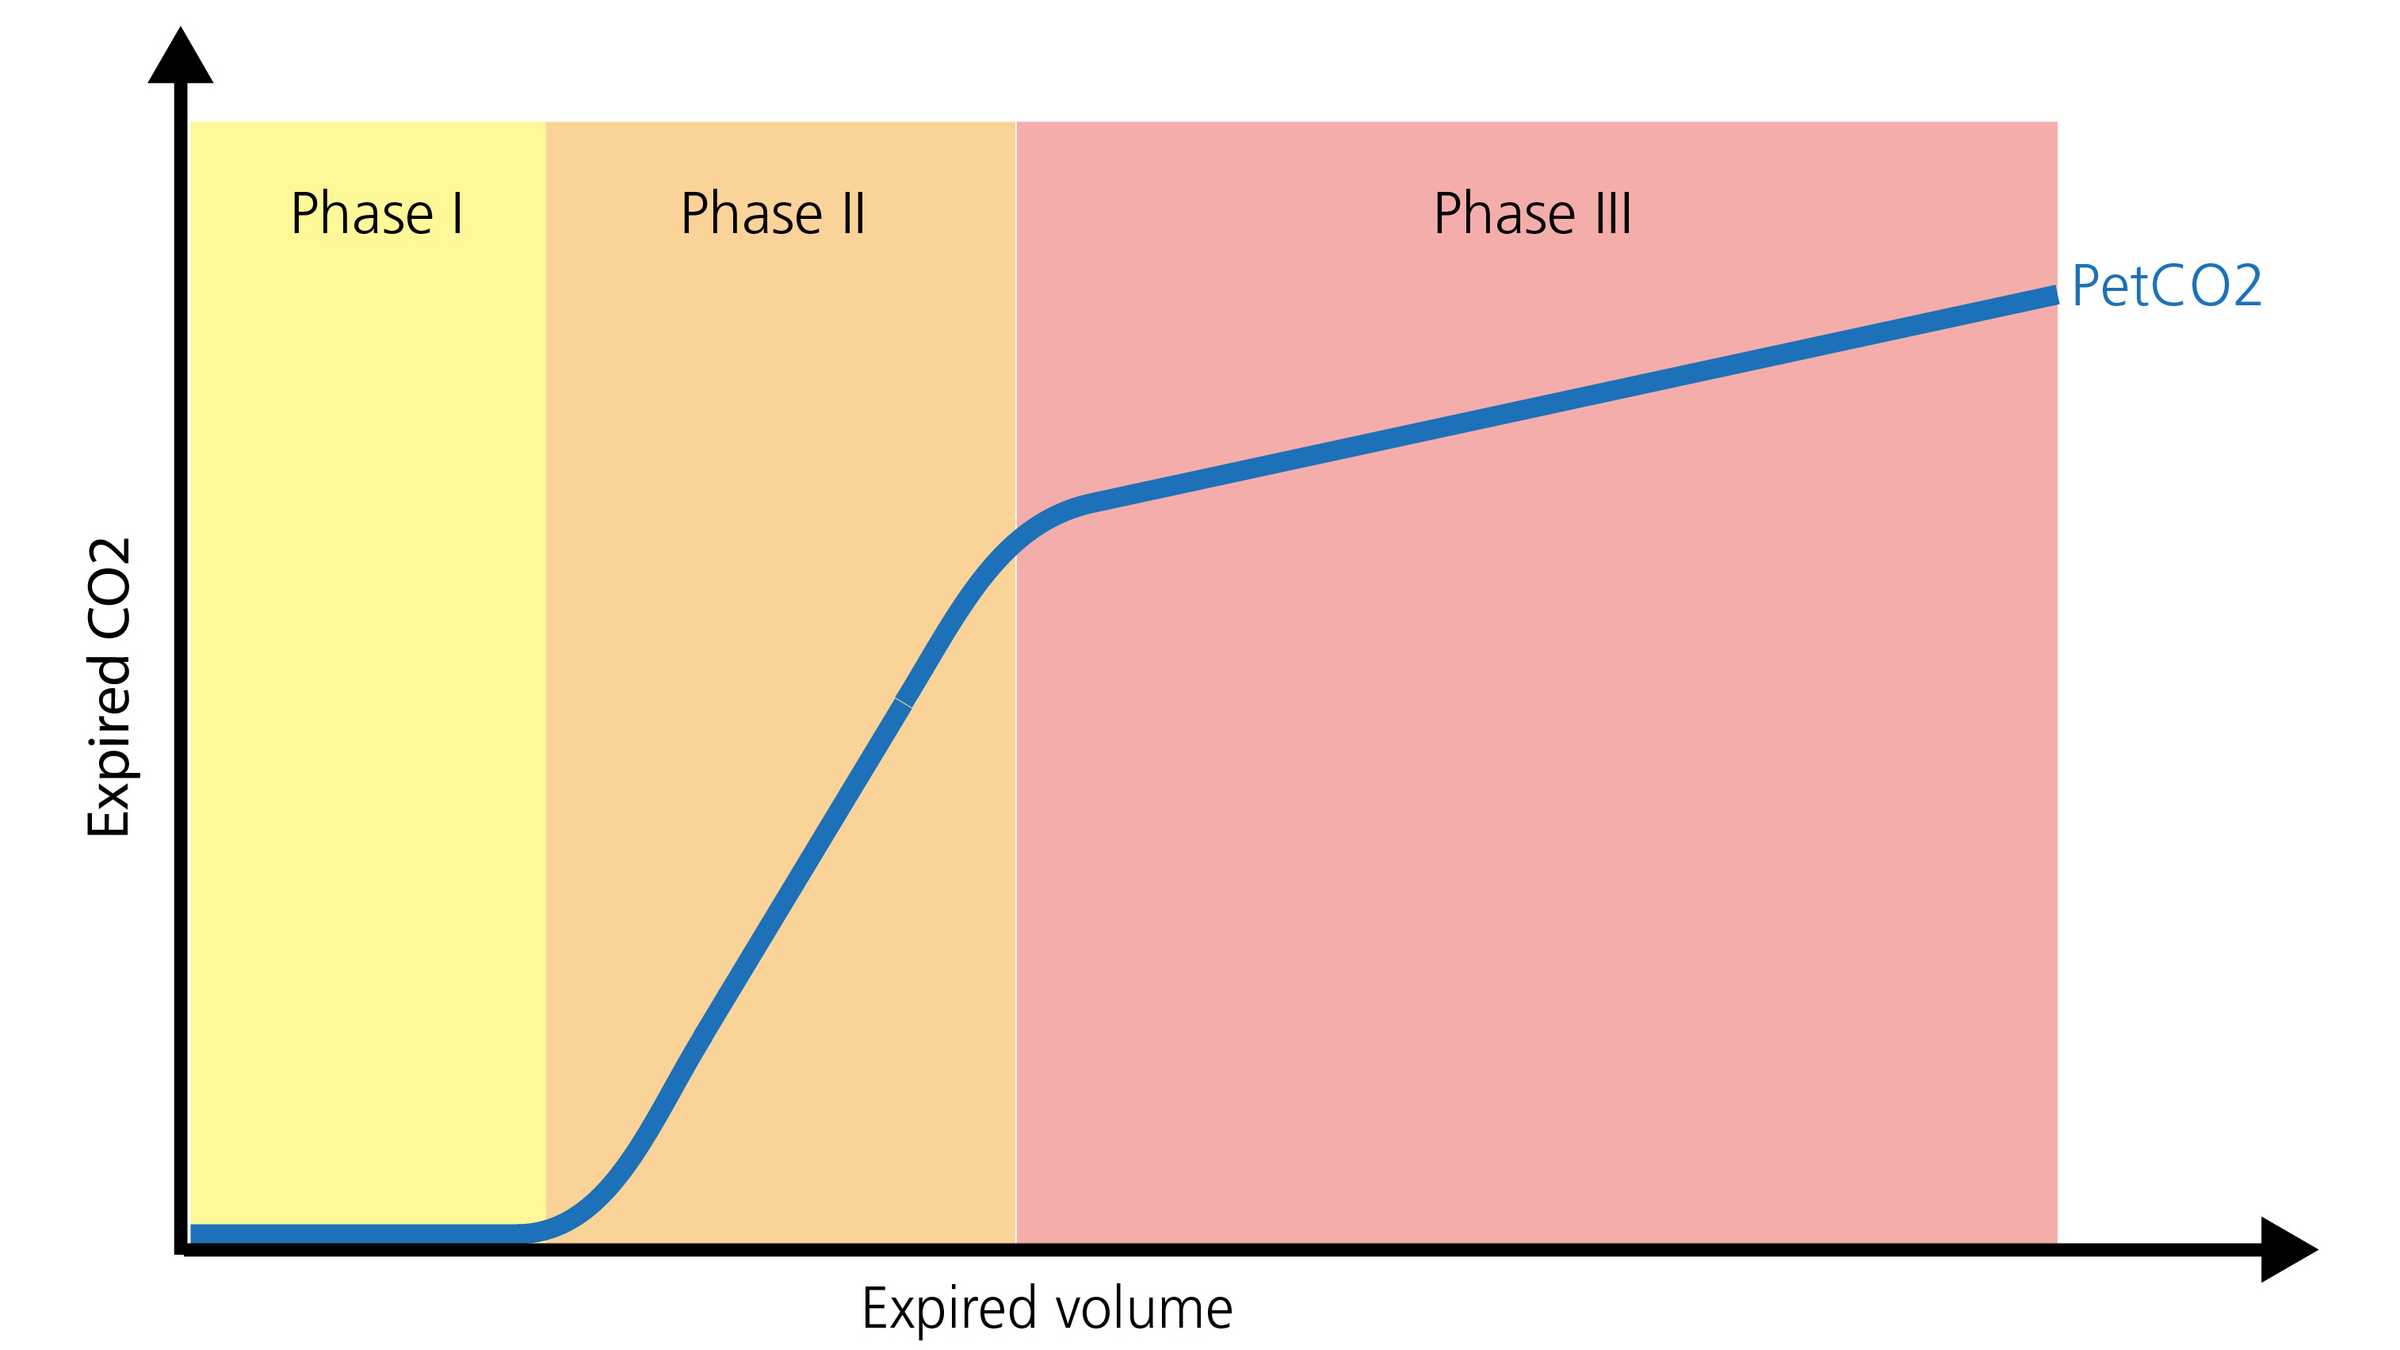
Die normale Form eines volumetrischen Kapnogramms umfasst drei Phasen. Es ist zu beachten, dass in einem Kapnogramm die Exspiration abgebildet wird.

  • Phase I stellt das Gas ohne CO2 aus den Atemwegen dar (anatomischer und instrumenteller Totraum).
  • Phase II ist eine Übergangsphase, in der sich das Gas aus den leitenden Atemwegen mit alveolärem Gas vermischt.
  • Phase III ist eine Plateauphase mit Gas aus den Alveolen und aus den sich langsam entleerenden Lungenarealen (Gravenstein, J., Jaffe, M., & Paulus, D. (2004). Capnography: Clinical Aspects. New York: Cambridge University Press.2​). In Abbildung 2 unten ist dies grafisch dargestellt.
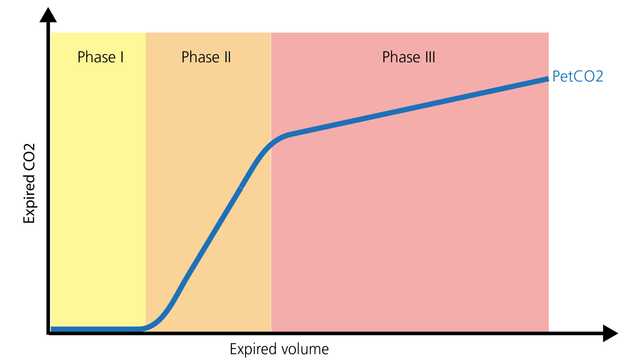
Schematische Darstellung mit drei Phasen
Abbildung 2
Schematische Darstellung mit drei Phasen
Abbildung 2

Kapnographie während des Transports

Bei Patienten, die innerhalb oder ausserhalb des Krankenhauses transportiert werden müssen, können sowohl die zeitbasierte als auch die volumetrische Kapnographie wertvolle Informationen zur Optimierung des Monitorings und Unterstützung der Pflege bereitstellen. Sie kann mit Endotrachealtuben, Tracheostomietuben sowie vielen supraglottischen Atemwegsvorrichtungen sicher eingesetzt werden, solange eine wirksame Abdichtung gegeben ist. Für die Platzierung und Durchgängigkeit der Atemwege, für das Monitoring der Beatmung und für den Perfusionsstatus liefert PetCO2 wichtige Informationen. Ein weiterer wertvoller Parameter ist das Volumen des pro Minute eliminierten Kohlendioxids (V'CO2), mit dem das Pflegepersonal die Wirksamkeit der Perfusion und der Bemühungen zur Volumensubstitution beurteilen kann (I-Gnaidy E., Abo El-Nasr, L., Ameen, S., & Abd El-Ghafar, M. (2019). Correlation between Carbon Dioxide Production and Mean Arterial Blood Pressure in Fluid Response in Mechanically Ventilated Patients. Medical Journal of Cairo University, 87(4), 2679-2684.3​).

Kapnographie auf der Intensivstation

Auf der Intensivstation kann die Kurven-Kapnographie die Überwachung der Platzierung und Durchgängigkeit der Atemwege mit verschiedenen Atemwegsvorrichtungen fortführen. Eine wichtige Messung mit der Kapnographie ist das Verhältnis von Totraum zu Tidalvolumen (Vd/Vt).  Ein zunehmendes Vd/Vt-Verhältnis kann je nach Stärke das Anstiegs auf eine mögliche erhöhte Mortalität hinweisen (Kallet RH, Alonso JA, Pittet JF, Matthay MA. Prognostic value of the pulmonary dead-space fraction during the first 6 days of acute respiratory distress syndrome. Respir Care. 2004;49(9):1008-1014. 4​, Nuckton TJ, Alonso JA, Kallet RH, et al. Pulmonary dead-space fraction as a risk factor for death in the acute respiratory distress syndrome. N Engl J Med. 2002;346(17):1281-1286. doi:10.1056/NEJMoa0128355​). Mit der PetCO2-Kurve und V’CO2 kann das Pflegepersonal das Lungenrecruitment optimieren, die optimale PEEP-Anpassung bewerten und Probleme mit der Perfusion (systemisch und lungenbezogen) erkennen (Kallet RH, Alonso JA, Pittet JF, Matthay MA. Prognostic value of the pulmonary dead-space fraction during the first 6 days of acute respiratory distress syndrome. Respir Care. 2004;49(9):1008-1014. 4​, Nuckton TJ, Alonso JA, Kallet RH, et al. Pulmonary dead-space fraction as a risk factor for death in the acute respiratory distress syndrome. N Engl J Med. 2002;346(17):1281-1286. doi:10.1056/NEJMoa0128355​, Blankman P, Shono A, Hermans BJ, Wesselius T, Hasan D, Gommers D. Detection of optimal PEEP for equal distribution of tidal volume by volumetric capnography and electrical impedance tomography during decreasing levels of PEEP in post cardiac-surgery patients. Br J Anaesth. 2016;116(6):862-869. doi:10.1093/bja/aew1166​, Nguyen LS, Squara P. Non-Invasive Monitoring of Cardiac Output in Critical Care Medicine. Front Med (Lausanne). 2017;4:200. Published 2017 Nov 20. doi:10.3389/fmed.2017.002007​). V’CO2 kann auch bei der Entwöhnung von der maschinellen Beatmung verwendet werden, da es dem Pflegepersonal Rückschlüsse auf eine mögliche Ermüdung des Patienten oder ein Fehlschlagen der Entwöhnung erlaubt (Erhöhung der Totraumfraktion, unzureichende Atembemühungen und Ermüdung der Atemmuskulatur). Der mit V’CO2 ermittelte Energieverbrauch ist eine genaue und präzise Methode, mit der das Pflegepersonal die Ernährungsbedürfnisse bei maschinell beatmeten Patienten berechnen kann (Stapel SN, de Grooth HJ, Alimohamad H, et al. Ventilator-derived carbon dioxide production to assess energy expenditure in critically ill patients: proof of concept. Crit Care. 2015;19:370. Published 2015 Oct 22. doi:10.1186/s13054-015-1087-28​).

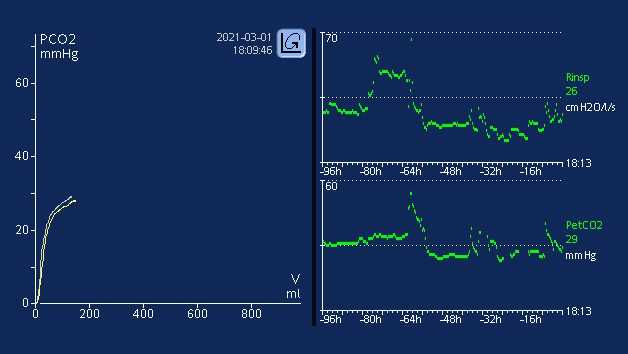
Alle Beatmungsgeräte von Hamilton Medical bieten volumetrische Kapnographie (Alle Modelle ausser HAMILTON-MR1A ), entweder als Standardausstattung oder als optionale Funktion. Die CO2-Messung wird mit einem CAPNOSTAT® 5 Hauptstrom-CO2-Sensor an der Atemwegsöffnung des Patienten vorgenommen. Zudem bieten die Beatmungsgeräte im Fenster „Monitoring“ > „CO2“ einen Überblick über alle wichtigen CO2-bezogenen Werte.

Volumetrischen Kapnographie (eBook)

Kostenloses eBook

Gut zu wissen! Alles über die volumetrische Kapnographie

Das eBook erklärt, wie ein volumetrisches Kapnogramm interpretiert wird, und stellt einen Überblick über die Vorteile und klinische Anwendung der volumetrischen Kapnographie zur Verfügung. Selbsttest inkludiert!

Fußnoten

  • A. Alle Modelle ausser HAMILTON-MR1.

Referenzen

  1. 1. Kremeier P, Böhm SH, Tusman G. Clinical use of volumetric capnography in mechanically ventilated patients. J Clin Monit Comput. 2020;34(1):7-16. doi:10.1007/s10877-019-00325-9
  2. 2. Gravenstein, J., Jaffe, M., & Paulus, D. (2004). Capnography: Clinical Aspects. New York: Cambridge University Press.
  3. 3. I-Gnaidy E., Abo El-Nasr, L., Ameen, S., & Abd El-Ghafar, M. (2019). Correlation between Cardon Dioxide Production and Mean Arterial Blood Pressure in Fluid Response in Mechanically Ventilated Patients. Medical Journal of Cairo University, 87(4), 2679-2684.
  4. 4. Kallet RH, Alonso JA, Pittet JF, Matthay MA. Prognostic value of the pulmonary dead-space fraction during the first 6 days of acute respiratory distress syndrome. Respir Care. 2004;49(9):1008-1014.
  5. 5. Nuckton TJ, Alonso JA, Kallet RH, et al. Pulmonary dead-space fraction as a risk factor for death in the acute respiratory distress syndrome. N Engl J Med. 2002;346(17):1281-1286. doi:10.1056/NEJMoa012835
  6. 6. Blankman P, Shono A, Hermans BJ, Wesselius T, Hasan D, Gommers D. Detection of optimal PEEP for equal distribution of tidal volume by volumetric capnography and electrical impedance tomography during decreasing levels of PEEP in post cardiac-surgery patients. Br J Anaesth. 2016;116(6):862-869. doi:10.1093/bja/aew116
  7. 7. Nguyen LS, Squara P. Non-Invasive Monitoring of Cardiac Output in Critical Care Medicine. Front Med (Lausanne). 2017;4:200. Published 2017 Nov 20. doi:10.3389/fmed.2017.00200
  8. 8. Stapel SN, de Grooth HJ, Alimohamad H, et al. Ventilator-derived carbon dioxide production to assess energy expenditure in critically ill patients: proof of concept. Crit Care. 2015;19:370. Published 2015 Oct 22. doi:10.1186/s13054-015-1087-2

Clinical use of volumetric capnography in mechanically ventilated patients.

Kremeier P, Böhm SH, Tusman G. Clinical use of volumetric capnography in mechanically ventilated patients. J Clin Monit Comput. 2020;34(1):7-16. doi:10.1007/s10877-019-00325-9

Capnography is a first line monitoring system in mechanically ventilated patients. Volumetric capnography supports noninvasive and breath-by-breath information at the bedside using mainstream CO2 and flow sensors placed at the airways opening. This volume-based capnography provides information of important body functions related to the kinetics of carbon dioxide. Volumetric capnography goes one step forward standard respiratory mechanics and provides a new dimension for monitoring of mechanical ventilation. The article discusses the role of volumetric capnography for the clinical monitoring of mechanical ventilation.

Capnography: Clinical Aspects

Gravenstein, J., Jaffe, M., & Paulus, D. (2004). Capnography: Clinical Aspects. New York: Cambridge University Press.

Correlation between Carbon Dioxide Production and Mean Arterial Blood Pressure in Fluid Response in Mechanically Ventilated Patients

I-Gnaidy E., Abo El-Nasr, L., Ameen, S., & Abd El-Ghafar, M. (2019). Correlation between Cardon Dioxide Production and Mean Arterial Blood Pressure in Fluid Response in Mechanically Ventilated Patients. Medical Journal of Cairo University, 87(4), 2679-2684.

Prognostic value of the pulmonary dead-space fraction during the first 6 days of acute respiratory distress syndrome.

Kallet RH, Alonso JA, Pittet JF, Matthay MA. Prognostic value of the pulmonary dead-space fraction during the first 6 days of acute respiratory distress syndrome. Respir Care. 2004;49(9):1008-1014.


BACKGROUND

The ratio of pulmonary dead space to tidal volume (VD/VT) in acute respiratory distress syndrome (ARDS) is reported to be between 0.35 and 0.55. However, VD/VT has seldom been measured with consideration to the evolving pathophysiology of ARDS.

METHODS

We made serial VD/VT measurements with 59 patients who required mechanical ventilation for > or = 6 days. We measured VD/VT within 24 h of the point at which the patient met the American-European Consensus Conference criteria for ARDS, and we repeated the VD/VT measurement on ARDS days 2, 3, and 6 with a bedside metabolic monitor during volume-regulated ventilation. We analyzed the changes in VD/VT over the 6-day period to determine whether VD/VT has a significant association with mortality.

RESULTS

VD/VT was significantly higher in nonsurvivors on day 1 (0.61 +/- 0.09 vs 0.54 +/- 0.08, p < 0.05), day 2 (0.63 +/- 0.09 vs 0.53 +/- 0.09, p < 0.001), day 3 (0.64 +/- 0.09 vs 0.53 +/- 0.09, p < 0.001), and day 6 (0.66 +/- 0.09 vs 0.51 +/- 0.08, p < 0.001).

CONCLUSION

In ARDS a sustained VD/VT elevation is characteristic of nonsurvivors, so dead-space measurements made beyond the first 24 hours may have prognostic value.

Pulmonary dead-space fraction as a risk factor for death in the acute respiratory distress syndrome.

Nuckton TJ, Alonso JA, Kallet RH, et al. Pulmonary dead-space fraction as a risk factor for death in the acute respiratory distress syndrome. N Engl J Med. 2002;346(17):1281-1286. doi:10.1056/NEJMoa012835


BACKGROUND

No single pulmonary-specific variable, including the severity of hypoxemia, has been found to predict the risk of death independently when measured early in the course of the acute respiratory distress syndrome. Because an increase in the pulmonary dead-space fraction has been described in observational studies of the syndrome, we systematically measured the dead-space fraction early in the course of the illness and evaluated its potential association with the risk of death.

METHODS

The dead-space fraction was prospectively measured in 179 intubated patients, a mean (+/-SD) of 10.9+/-7.4 hours after the acute respiratory distress syndrome had developed. Additional clinical and physiological variables were analyzed with the use of multiple logistic regression. The study outcome was mortality before hospital discharge.

RESULTS

The mean dead-space fraction was markedly elevated (0.58+/-0.09) early in the course of the acute respiratory distress syndrome and was higher among patients who died than among those who survived (0.63+/-0.10 vs. 0.54+/-0.09, P<0.001). The dead-space fraction was an independent risk factor for death: for every 0.05 increase, the odds of death increased by 45 percent (odds ratio, 1.45; 95 percent confidence interval, 1.15 to 1.83; P=0.002). The only other independent predictors of an increased risk of death were the Simplified Acute Physiology Score II, an indicator of the severity of illness (odds ratio, 1.06; 95 percent confidence interval, 1.03 to 1.08; P<0.001) and quasistatic respiratory compliance (odds ratio, 1.06; 95 percent confidence interval, 1.01 to 1.10; P=0.01).

CONCLUSIONS

Increased dead-space fraction is a feature of the early phase of the acute respiratory distress syndrome. Elevated values are associated with an increased risk of death.

Detection of optimal PEEP for equal distribution of tidal volume by volumetric capnography and electrical impedance tomography during decreasing levels of PEEP in post cardiac-surgery patients.

Blankman P, Shono A, Hermans BJ, Wesselius T, Hasan D, Gommers D. Detection of optimal PEEP for equal distribution of tidal volume by volumetric capnography and electrical impedance tomography during decreasing levels of PEEP in post cardiac-surgery patients. Br J Anaesth. 2016;116(6):862-869. doi:10.1093/bja/aew116


BACKGROUND

Homogeneous ventilation is important for prevention of ventilator-induced lung injury. Electrical impedance tomography (EIT) has been used to identify optimal PEEP by detection of homogenous ventilation in non-dependent and dependent lung regions. We aimed to compare the ability of volumetric capnography and EIT in detecting homogenous ventilation between these lung regions.

METHODS

Fifteen mechanically-ventilated patients after cardiac surgery were studied. Ventilator settings were adjusted to volume-controlled mode with a fixed tidal volume (Vt) of 6-8 ml kg(-1) predicted body weight. Different PEEP levels were applied (14 to 0 cm H2O, in steps of 2 cm H2O) and blood gases, Vcap and EIT were measured.

RESULTS

Tidal impedance variation of the non-dependent region was highest at 6 cm H2O PEEP, and decreased significantly at 14 cm H2O PEEP indicating decrease in the fraction of Vt in this region. At 12 cm H2O PEEP, homogenous ventilation was seen between both lung regions. Bohr and Enghoff dead space calculations decreased from a PEEP of 10 cm H2O. Alveolar dead space divided by alveolar Vt decreased at PEEP levels ≤6 cm H2O. The normalized slope of phase III significantly changed at PEEP levels ≤4 cm H2O. Airway dead space was higher at higher PEEP levels and decreased at the lower PEEP levels.

CONCLUSIONS

In postoperative cardiac patients, calculated dead space agreed well with EIT to detect the optimal PEEP for an equal distribution of inspired volume, amongst non-dependent and dependent lung regions. Airway dead space reduces at decreasing PEEP levels.

Non-Invasive Monitoring of Cardiac Output in Critical Care Medicine.

Nguyen LS, Squara P. Non-Invasive Monitoring of Cardiac Output in Critical Care Medicine. Front Med (Lausanne). 2017;4:200. Published 2017 Nov 20. doi:10.3389/fmed.2017.00200

Critically ill patients require close hemodynamic monitoring to titrate treatment on a regular basis. It allows administering fluid with parsimony and adjusting inotropes and vasoactive drugs when necessary. Although invasive monitoring is considered as the reference method, non-invasive monitoring presents the obvious advantage of being associated with fewer complications, at the expanse of accuracy, precision, and step-response change. A great many methods and devices are now used over the world, and this article focuses on several of them, providing with a brief review of related underlying physical principles and validation articles analysis. Reviewed methods include electrical bioimpedance and bioreactance, respiratory-derived cardiac output (CO) monitoring technique, pulse wave transit time, ultrasound CO monitoring, multimodal algorithmic estimation, and inductance thoracocardiography. Quality criteria with which devices were reviewed included: accuracy (closeness of agreement between a measurement value and a true value of the measured), precision (closeness of agreement between replicate measurements on the same or similar objects under specified conditions), and step response change (delay between physiological change and its indication). Our conclusion is that the offer of non-invasive monitoring has improved in the past few years, even though further developments are needed to provide clinicians with sufficiently accurate devices for routine use, as alternative to invasive monitoring devices.

Ventilator-derived carbon dioxide production to assess energy expenditure in critically ill patients: proof of concept.

Stapel SN, de Grooth HJ, Alimohamad H, et al. Ventilator-derived carbon dioxide production to assess energy expenditure in critically ill patients: proof of concept. Crit Care. 2015;19:370. Published 2015 Oct 22. doi:10.1186/s13054-015-1087-2


INTRODUCTION

Measurement of energy expenditure (EE) is recommended to guide nutrition in critically ill patients. Availability of a gold standard indirect calorimetry is limited, and continuous measurement is unfeasible. Equations used to predict EE are inaccurate. The purpose of this study was to provide proof of concept that EE can be accurately assessed on the basis of ventilator-derived carbon dioxide production (VCO2) and to determine whether this method is more accurate than frequently used predictive equations.

METHODS

In 84 mechanically ventilated critically ill patients, we performed 24-h indirect calorimetry to obtain a gold standard EE. Simultaneously, we collected 24-h ventilator-derived VCO2, extracted the respiratory quotient of the administered nutrition, and calculated EE with a rewritten Weir formula. Bias, precision, and accuracy and inaccuracy rates were determined and compared with four predictive equations: the Harris-Benedict, Faisy, and Penn State University equations and the European Society for Clinical Nutrition and Metabolism (ESPEN) guideline equation of 25 kcal/kg/day.

RESULTS

Mean 24-h indirect calorimetry EE was 1823 ± 408 kcal. EE from ventilator-derived VCO2 was accurate (bias +141 ± 153 kcal/24 h; 7.7 % of gold standard) and more precise than the predictive equations (limits of agreement -166 to +447 kcal/24 h). The 10 % and 15 % accuracy rates were 61 % and 76 %, respectively, which were significantly higher than those of the Harris-Benedict, Faisy, and ESPEN guideline equations. Large errors of more than 30 % inaccuracy did not occur with EE derived from ventilator-derived VCO2. This 30 % inaccuracy rate was significantly lower than that of the predictive equations.

CONCLUSIONS

In critically ill mechanically ventilated patients, assessment of EE based on ventilator-derived VCO2 is accurate and more precise than frequently used predictive equations. It allows for continuous monitoring and is the best alternative to indirect calorimetry.

Related articles. Get a deeper look