Zurück

Beurteilung der Rekrutierbarkeit mithilfe einer Druck/Volumen‑Kurve

Artikel

Autor: Jean‑Michel Arnal

Datum: 09.04.2024

Eine bewährte Methode zur Beurteilung der Rekrutierbarkeit der Lunge ist die Verwendung einer Druck/Volumen‑Kurve.

Einstellungen für das P/V Tool

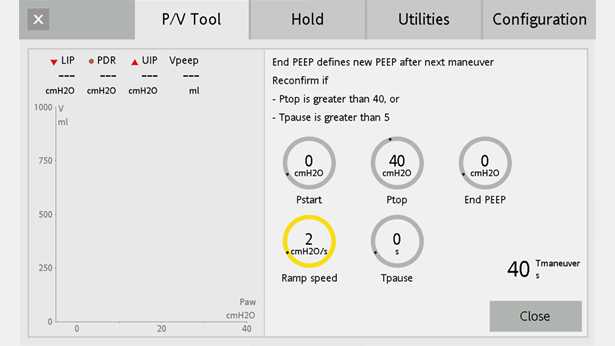
Die Beurteilung der Rekrutierbarkeit am Patientenbett kann bei komplett passiven Patienten mit früh auftretendem ARDS durchgeführt werden, wenn keine Leckagen im Beatmungskreislauf auftreten. Im Tab P/V Tool ( Auf den Beatmungsgeräten HAMILTON‑G5 und HAMILTON‑C3/C6 als Option verfügbar.A​, Standardausstattung auf dem HAMILTON‑S1.B​) starte ich mit den folgenden Einstellungen (siehe Abbildung 1):

  • P Start = 0 cmH2O
  • P top = 40 cmH2O
  • End PEEP = 0 cmH2O
  • Anstiegzeit = 2 cmH2O/s
  • Tpause = 0 s

Beachten Sie, dass dieselbe Beurteilung mit den Standardeinstellungen am Beatmungsgerät für P Start und End PEEP (5 cmH2O) durchgeführt werden kann.

Screenshot of ventilator display showing P/V Tool settings
Abbildung 1

Interpretation

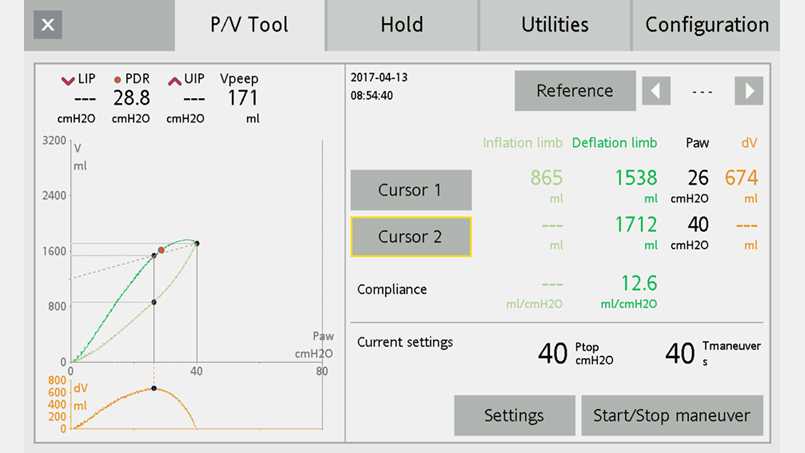
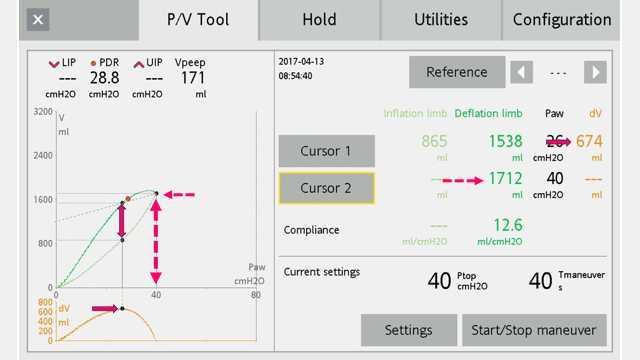
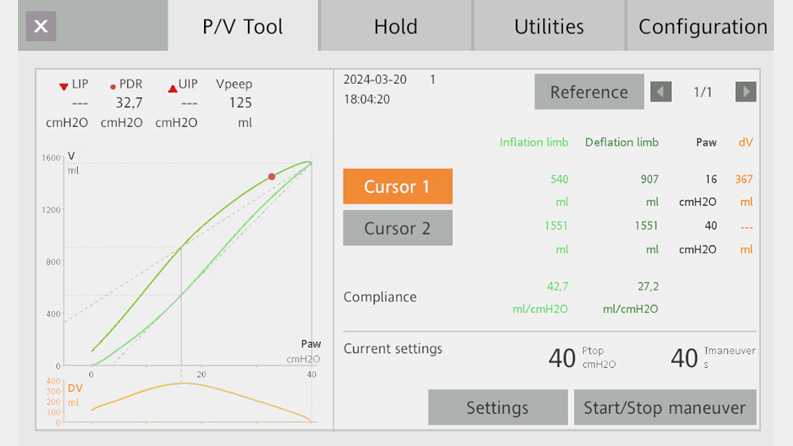
Wählen Sie die Grafik, die die P/V‑Kurve gemeinsam mit der automatischen Berechnung des Volumenunterschieds für jeden Druck darstellt (Paw/V + Paw/dV) (Abbildungen 2 und 3).

  • Positionieren Sie den Cursor 1 an dem Punkt, der den maximalen Abstand zwischen der Inspirations‑ und der Exspirationskurve markiert (dies entspricht dem höchsten Punkt der dv‑Kurve).
  • Positionieren Sie den Cursor 2 an dem Punkt, der das während des Manövers erreichte Maximalvolumen markiert (beim höchsten Druck)  

Jetzt können Sie den normalisierten Maximalabstand (NMA) berechnen. Der NMA wird in Prozent ausgedrückt und entspricht dem Maximalabstand dividiert durch das Maximalvolumen.

Im vorliegenden Beispiel: NMA = (674/1712) x 100 = 39%

Der Wert für NMA% von 41 kann herangezogen werden, um Lungen mit hohen Erfolgsaussichten für das Recruitment (NMA% ≥ 41) von Lungen mit niedrigen Erfolgsaussichten zu unterscheiden, bei denen sich ein Recruitment als schwieriger erweisen könnte (NMA% < 41) (
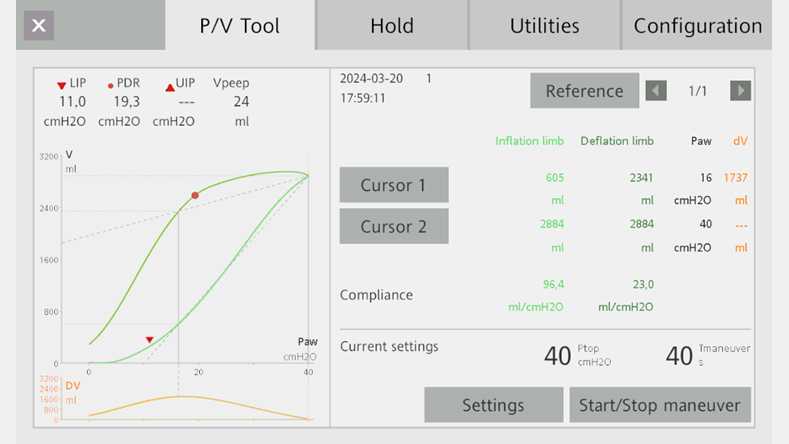
Chiumello D, Arnal JM, Umbrello M, et al. Hysteresis and Lung Recruitment in Acute Respiratory Distress Syndrome Patients: A CT Scan Study [die veröffentlichte Korrektur erscheint in Crit Care Med. 2022 Mar 1;50(3):e339]. Crit Care Med. 2020;48(10):1494‑1502. doi:10.1097/CCM.00000000000045181​).

Screenshot der Grafik „Paw/V + Paw/dV“
Abbildung 2
Screenshot, in dem Maximalvolumen und Deltavolumen markiert sind
Abbildung 3

Beispiele

Abbildung 4:
Herr A. ist ein 72‑jähriger Patient, der mit ARDS aufgenommen wurde.
NMA = (1737/2884) x 100 = 60 %
Dieser Patient wird wahrscheinlich von einer Recruitmentstrategie profitieren.

Abbildung 5:
Herr L. ist ein 66‑jähriger Patient, der mit ARDS aufgenommen wurde.
NMA = (367/1551) x 100 = 24 %
Dieser Patient wird wahrscheinlich nicht von einer Recruitmentstrategie profitieren.

Screenshot eines P/V-Loops mit Maximalabstand von 1737 und Maximalvolumen von 2884
Abbildung 4
Screenshot eines P/V-Loops mit Maximalabstand von 367 und Maximalvolumen von 1551
Abbildung 5
Screenshot of ventilator display showing P/V Tool settings
Abbildung 1
Screenshot der Grafik „Paw/V + Paw/dV“
Abbildung 2
Screenshot, in dem Maximalvolumen und Deltavolumen markiert sind
Abbildung 3
Screenshot eines P/V-Loops mit Maximalabstand von 1737 und Maximalvolumen von 2884
Abbildung 4
Screenshot eines P/V-Loops mit Maximalabstand von 367 und Maximalvolumen von 1551
Abbildung 5

Hysteresis and Lung Recruitment in Acute Respiratory Distress Syndrome Patients: A CT Scan Study.

Chiumello D, Arnal JM, Umbrello M, et al. Hysteresis and Lung Recruitment in Acute Respiratory Distress Syndrome Patients: A CT Scan Study [published correction appears in Crit Care Med. 2022 Mar 1;50(3):e339]. Crit Care Med. 2020;48(10):1494‑1502. doi:10.1097/CCM.0000000000004518


OBJECTIVES

Hysteresis of the respiratory system pressure‑volume curve is related to alveolar surface forces, lung stress relaxation, and tidal reexpansion/collapse. Hysteresis has been suggested as a means of assessing lung recruitment. The objective of this study was to determine the relationship between hysteresis, mechanical characteristics of the respiratory system, and lung recruitment assessed by a CT scan in mechanically ventilated acute respiratory distress syndrome patients.

DESIGN

Prospective observational study.

SETTING

General ICU of a university hospital.

PATIENTS

Twenty-five consecutive sedated and paralyzed patients with acute respiratory distress syndrome (age 64 ± 15 yr, body mass index 26 ± 6 kg/m, PaO2/FIO2 147 ± 42, and positive end-expiratory pressure 9.3 ± 1.4 cm H2O) were enrolled.

INTERVENTIONS

A low-flow inflation and deflation pressure-volume curve (5-45 cm H2O) and a sustained inflation recruitment maneuver (45 cm H2O for 30 s) were performed. A lung CT scan was performed during breath-holding pressure at 5 cm H2O and during the recruitment maneuver at 45 cm H2O.

MEASUREMENTS AND MAIN RESULTS

Lung recruitment was computed as the difference in noninflated tissue and in gas volume measured at 5 and at 45 cm H2O. Hysteresis was calculated as the ratio of the area enclosed by the pressure-volume curve and expressed as the hysteresis ratio. Hysteresis was correlated with respiratory system compliance computed at 5 cm H2O and the lung gas volume entering the lung during inflation of the pressure-volume curve (R = 0.749, p < 0.001 and R = 0.851, p < 0.001). The hysteresis ratio was related to both lung tissue and gas recruitment (R = 0.266, p = 0.008, R = 0.357, p = 0.002, respectively). Receiver operating characteristic analysis showed that the optimal cutoff value to predict lung tissue recruitment for the hysteresis ratio was 28% (area under the receiver operating characteristic curve, 0.80; 95% CI, 0.62-0.98), with sensitivity and specificity of 0.75 and 0.77, respectively.

CONCLUSIONS

Hysteresis of the respiratory system computed by low-flow pressure-volume curve is related to the anatomical lung characteristics and has an acceptable accuracy to predict lung recruitment.