Author: David Grooms
Date of first publication: 08.07.2019
An ineffective effort is defined as a patient effort that is unable to trigger the delivery of a mechanical breath.

What are the causes?
The most common causes are:
- Trigger threshold set too high
- Pressure support too high
- Set frequency and/or inspiratory time too high (in controlled/assisted modes)
- Tidal volume set too high
- Presence of AutoPEEP
- Low respiratory drive
- Weak inspiratory effort
- Sedation
What is visible on the waveform?
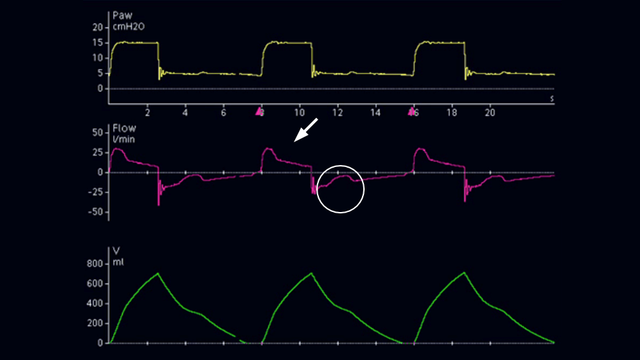
Several waveform characteristics can assist in the diagnosis (see Figure 1):
- The pressure/time scalar waveform will show a decrease in baseline airway pressure not followed by ventilator support
- The flow/time scalar waveform will reveal an abrupt change in the steepness of the waveform (decrease in expiratory flow or increase in inspiratory flow not followed by ventilator support)
- The esophageal pressure/time scalar waveform will display a decrease in pleural pressure not followed by ventilator support

How can I resolve the issue?
The most practical adjustments that can be made on the ventilator to reduce ineffective efforts are as follows:
- Minimize AutoPEEP by reducing minute ventilation
- Reduce pressure support and/or tidal volume
- Adjust the expiratory trigger sensitivity (ETS) to make it more sensitive to the patient's activity (see Figures 2 and 3)


