We have detected that you are visiting our website from United States.
We offer a separate version of the website for your country (United States).

Switch to United States
 Technologies

The Ventilation Cockpit. See complex data clearly

Hamilton ventilator family

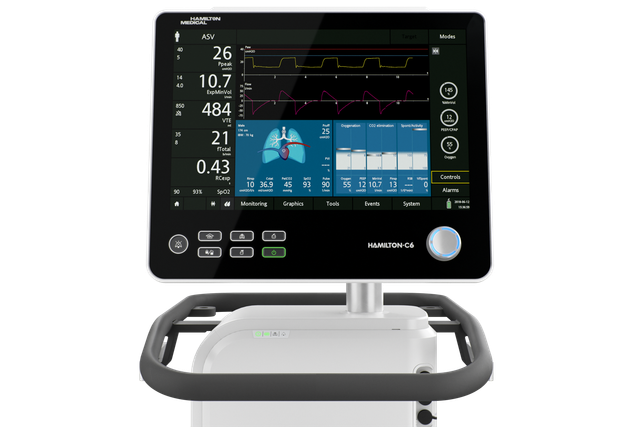
Our vision. One interface to operate them all

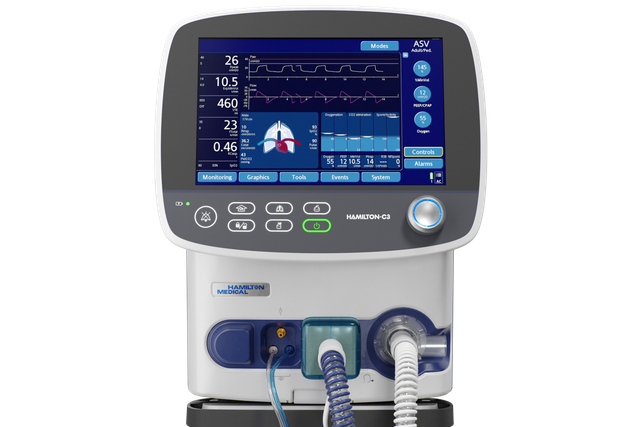
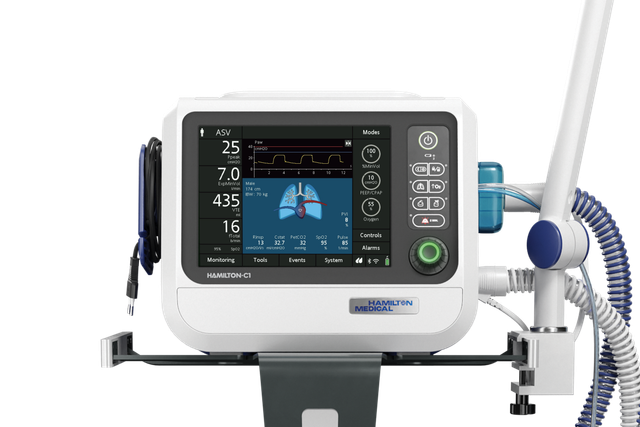
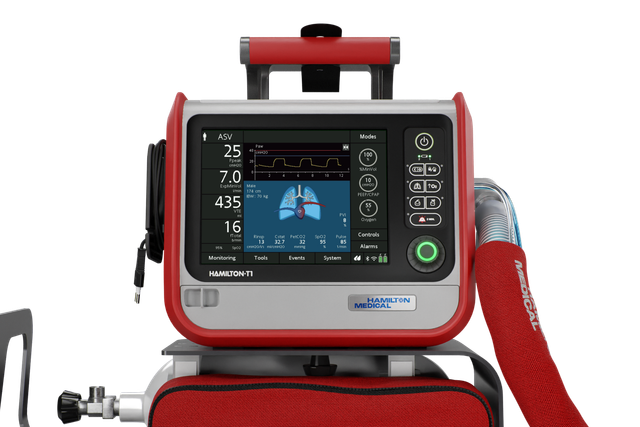
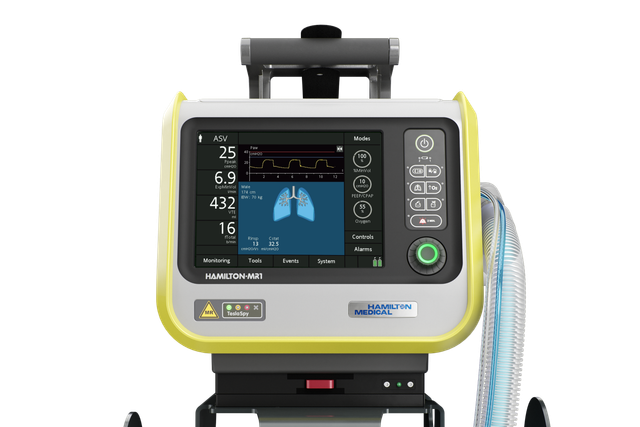
Whether the device is being used in the ICU, in the MRI suite, or during transport, the user interface on all our ventilators is operated in the same way.

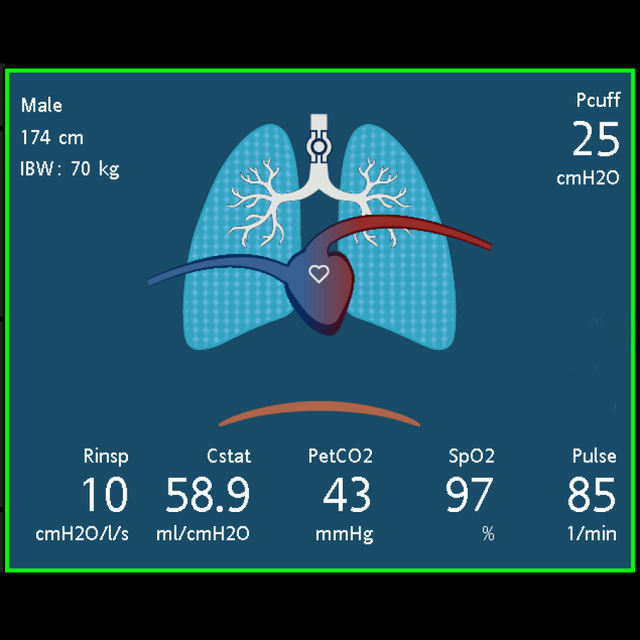
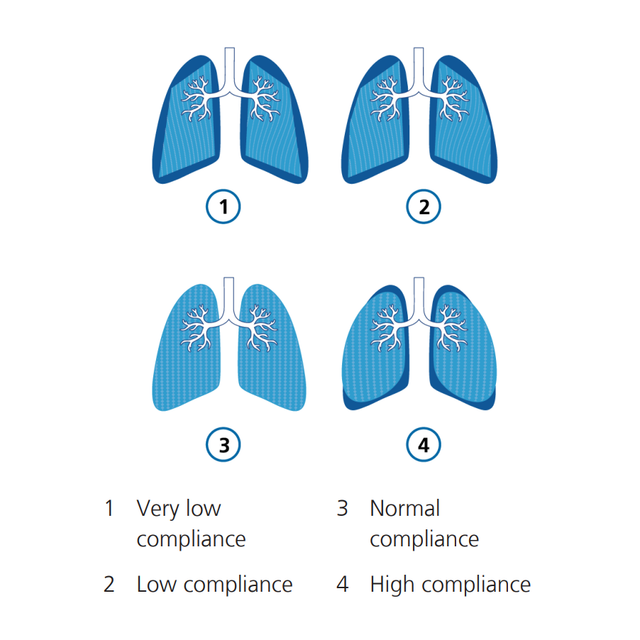
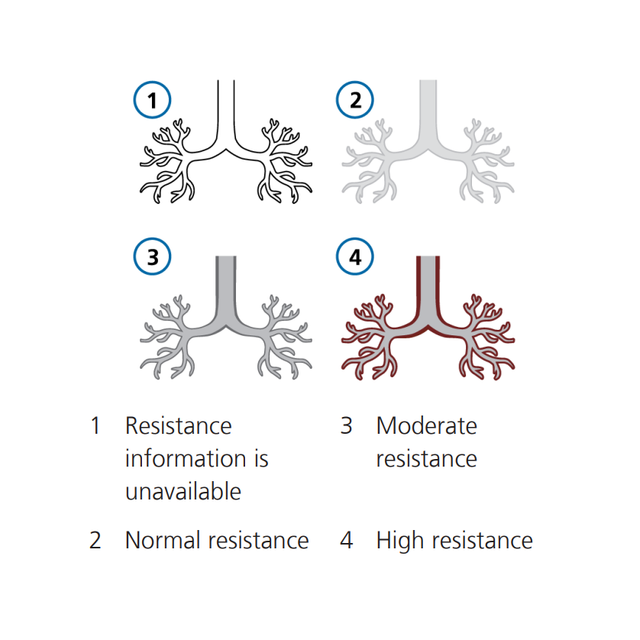
Our Ventilation Cockpit integrates complex data into intuitive visualizations.

The inspiration. Graphical representation of complex data

A study found that numerical and waveform displays alone are not enough to provide clinicians with an optimal level of support (Drews FA, Westenskow DR. The right picture is worth a thousand numbers: data displays in anesthesia. Hum Factors. 2006;48(1):59-71. doi:10.1518/0018720067764122701​). As an alternative, graphical displays that integrate data into visualizations can help clinicians detect and treat adverse respiratory events faster, which can lead to a perceived decrease in workload (Wachter SB, Johnson K, Albert R, Syroid N, Drews F, Westenskow D. The evaluation of a pulmonary display to detect adverse respiratory events using high resolution human simulator. J Am Med Inform Assoc. 2006;13(6):635-642. doi:10.1197/jamia.M21232​).

Our Ventilation Cockpit was inspired by aircraft cockpits where complex data is integrated and visualized in a simplified way.


Insight into an airplane cockpit with pilots operating the cockpit. Insight into an airplane cockpit with pilots operating the cockpit.
Vent status panel

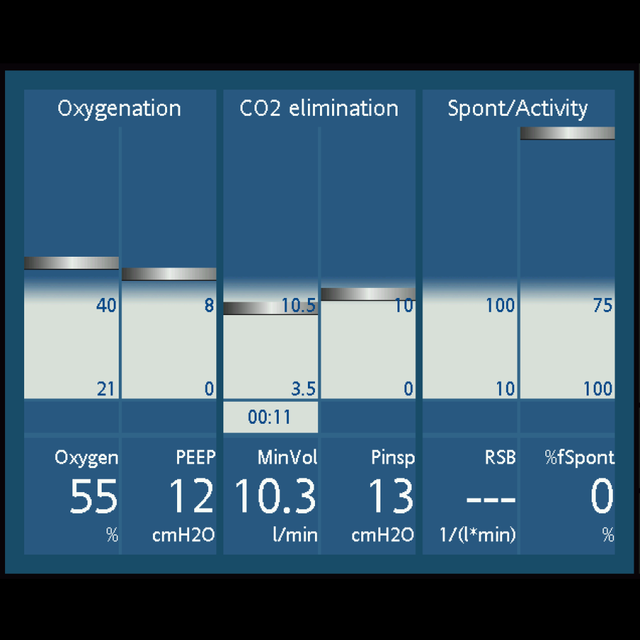
Ready to wean? The Vent Status panel

The Vent Status panel displays six parameters related to the patient’s ventilator dependence, including oxygenation, CO2 elimination, and patient activity.

A floating indicator within the column shows the value for a given parameter breath by breath. When the indicator enters the grey weaning zone, a timer starts, showing how long that value has been in the weaning zone.

When all values are in the weaning zone, the panel is framed in green, indicating that spontaneous breathing trials can be considered.

Craig Jolly

Customer voices

In my experience the Dynamic Lung is very helpful, because not everybody can always interpret the numbers, especially therapists who are just starting out. But they can understand the picture.

Craig Jolly

Clinical Education Coordinator
University Medical Center, Lubbock (TX), USA

Availability

The Ventilation Cockpit is a standard feature on all our critical care ventilators.

The right picture is worth a thousand numbers: data displays in anesthesia.

Drews FA, Westenskow DR. The right picture is worth a thousand numbers: data displays in anesthesia. Hum Factors. 2006;48(1):59-71. doi:10.1518/001872006776412270


OBJECTIVE

To review the literature on data displays in anesthesia identifying issues and developing design recommendations.

BACKGROUND

Unexpected incidents are common in critical care medicine. Adverse outcomes are frequently the catastrophic endpoints of an "evolving" chain of subtle incidents. One strategy to reduce the likelihood of an adverse patient outcome during anesthesia is to improve the anesthesiologist's ability to detect, diagnose, and treat critical incidents.

METHOD

A literature review and analysis of data displays.

RESULTS

Current numerical and waveform displays do not support anesthesiologists optimally. An alternative is graphical displays that functionally integrate variables into objects. In a well-designed graphic object, deviations from normal are shown by distortions in the object's symmetry. The emerging patterns that result from distorted symmetry facilitate the correct diagnosis. When treatment is effective, an object's shape is restored to normal. Graphical displays can be an effective tool in supporting anesthesiologists' situation awareness.

CONCLUSION

Problems related to graphical displays have delayed their use in anesthesia, including the lack of conclusive clinical evidence of their value. However, currently more evidence is accumulating that graphical displays have the potential to improve clinical performance. The successful development of these graphical displays takes into account task requirements, a user's perceptual processes, and task-specific cognition.

APPLICATION

This paper provides suggestions for the development of more effective displays in anesthesiology. Graphical displays can increase the anesthesiologist's situation awareness and improve clinical performance. Clinical use of these displays has the potential to significantly improve patient safety.

The evaluation of a pulmonary display to detect adverse respiratory events using high resolution human simulator.

Wachter SB, Johnson K, Albert R, Syroid N, Drews F, Westenskow D. The evaluation of a pulmonary display to detect adverse respiratory events using high resolution human simulator. J Am Med Inform Assoc. 2006;13(6):635-642. doi:10.1197/jamia.M2123


OBJECTIVE

Authors developed a picture-graphics display for pulmonary function to present typical respiratory data used in perioperative and intensive care environments. The display utilizes color, shape and emergent alerting to highlight abnormal pulmonary physiology. The display serves as an adjunct to traditional operating room displays and monitors.

DESIGN

To evaluate the prototype, nineteen clinician volunteers each managed four adverse respiratory events and one normal event using a high-resolution patient simulator which included the new displays (intervention subjects) and traditional displays (control subjects). Between-group comparisons included (i) time to diagnosis and treatment for each adverse respiratory event; (ii) the number of unnecessary treatments during the normal scenario; and (iii) self-reported workload estimates while managing study events.

MEASUREMENTS

Two expert anesthesiologists reviewed video-taped transcriptions of the volunteers to determine time to treat and time to diagnosis. Time values were then compared between groups using a Mann-Whitney-U Test. Estimated workload for both groups was assessed using the NASA-TLX and compared between groups using an ANOVA. P-values < 0.05 were considered significant.

RESULTS

Clinician volunteers detected and treated obstructed endotracheal tubes and intrinsic PEEP problems faster with graphical rather than conventional displays (p < 0.05). During the normal scenario simulation, 3 clinicians using the graphical display, and 5 clinicians using the conventional display gave unnecessary treatments. Clinician-volunteers reported significantly lower subjective workloads using the graphical display for the obstructed endotracheal tube scenario (p < 0.001) and the intrinsic PEEP scenario (p < 0.03).

CONCLUSION

Authors conclude that the graphical pulmonary display may serve as a useful adjunct to traditional displays in identifying adverse respiratory events.