Indietro

Doppio trigger: diagnosi, distinzione e soluzione

Articolo

Autore: David Grooms

Data: 08.07.2019

La mancata sincronia nell'interfaccia tra paziente e ventilatore è un fenomeno comune nei pazienti ventilati in modo invasivo e non invasivo. Il termine "dissincronia" implica un'anomalia della sincronia attesa tra paziente e ventilatore.
Doppio trigger: diagnosi, distinzione e soluzione

Contenuti chiave

  • Le mancate sincronie tra paziente e ventilatore, dette anche "dissincronie", sono comuni nei pazienti ventilati meccanicamente.
  • Una delle forme con maggiore prevalenza è il doppio trigger, generalmente dovuto a una corrispondenza non perfetta tra i tempi inspiratori dei respiri meccanici e i tempi inspiratori neurali; si tratta di una situazione particolarmente rischiosa nei pazienti con ARDS poiché può determinare l'erogazione di un volume corrente eccessivo.
  • Diagnosticare il doppio trigger e distinguerne i tre diversi tipi può essere piuttosto difficile: richiede un'attenta osservazione e analisi delle curve scalari del ventilatore.
  • La tecnologia attuale può aiutare i medici a evitare il doppio trigger grazie alla regolazione automatica del tempo inspiratorio in base alle esigenze del paziente.

Cos'è il doppio trigger?

La frequenza delle dissincronie è stata studiata e si stima che si verifichino almeno una volta in almeno il 50% dei pazienti sottoposti a ventilazione meccanica per oltre 24 ore. Le due dissincronie più comuni sono il trigger inefficace (o trigger mancato) e il doppio trigger (DT) (Thille AW, Rodriguez P, Cabello B, Lellouche F, Brochard L. Patient-ventilator asynchrony during assisted mechanical ventilation. Intensive Care Med. 2006;32(10):1515-1522. doi:10.1007/s00134-006-0301-81). Il doppio trigger è definito come il verificarsi di due insufflazioni erogate dal ventilatore nell'arco di un singolo sforzo inspiratorio del paziente (Liao KM, Ou CY, Chen CW. Classifying different types of double triggering based on airway pressure and flow deflection in mechanically ventilated patients. Respir Care. 2011;56(4):460-466. doi:10.4187/respcare.007312). La causa all'origine di questo tipo di dissincronia è un tempo inspiratorio del respiro meccanico eccessivamente breve rispetto al tempo inspiratorio neurale del paziente. Il ciclaggio prematuro che si verifica quindi con il primo respiro può generare successivamente l'erogazione involontaria di un secondo respiro nell'arco di una sola attivazione inspiratoria. Questa situazione è problematica in particolare nei pazienti con sindrome da distress respiratorio acuto e si verifica più spesso durante la ventilazione a target di volume con flusso fissato, poiché questo tipo di ventilazione può causare l'erogazione di un volume corrente eccessivo, con una conseguente sovrapposizione dei respiri (Pohlman MC, McCallister KE, Schweickert WD, et al. Excessive tidal volume from breath stacking during lung-protective ventilation for acute lung injury. Crit Care Med. 2008;36(11):3019-3023. doi:10.1097/CCM.0b013e31818b308b3). Sebbene il principio di base sia semplice da comprendere, la corretta identificazione di questo problema viene spesso trascurata, con una mancata diagnosi da parte dell'utente del ventilatore (Colombo D, Cammarota G, Alemani M, et al. Efficacy of ventilator waveforms observation in detecting patient-ventilator asynchrony. Crit Care Med. 2011;39(11):2452-2457. doi:10.1097/CCM.0b013e318225753c4).

Diagnosi e risoluzione

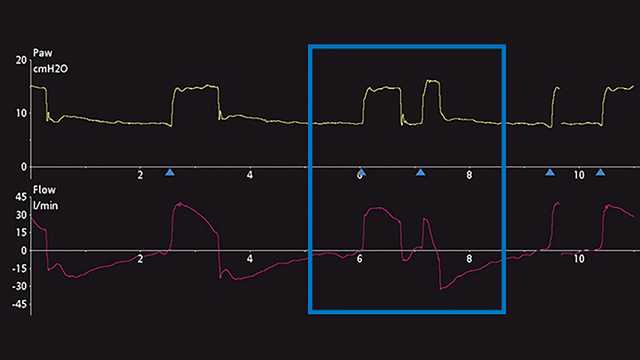
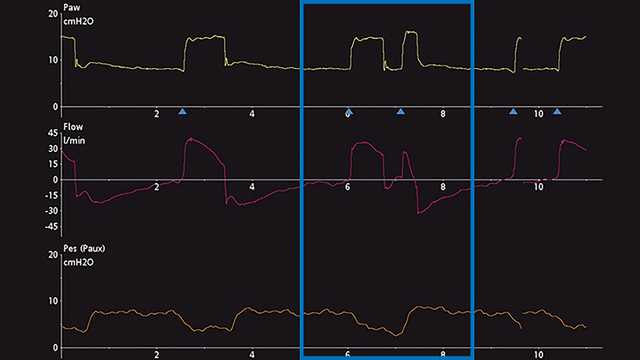
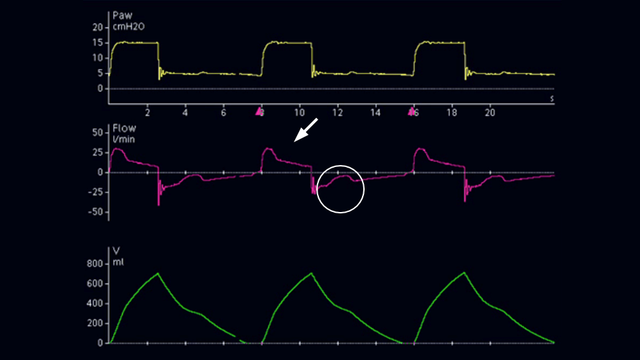
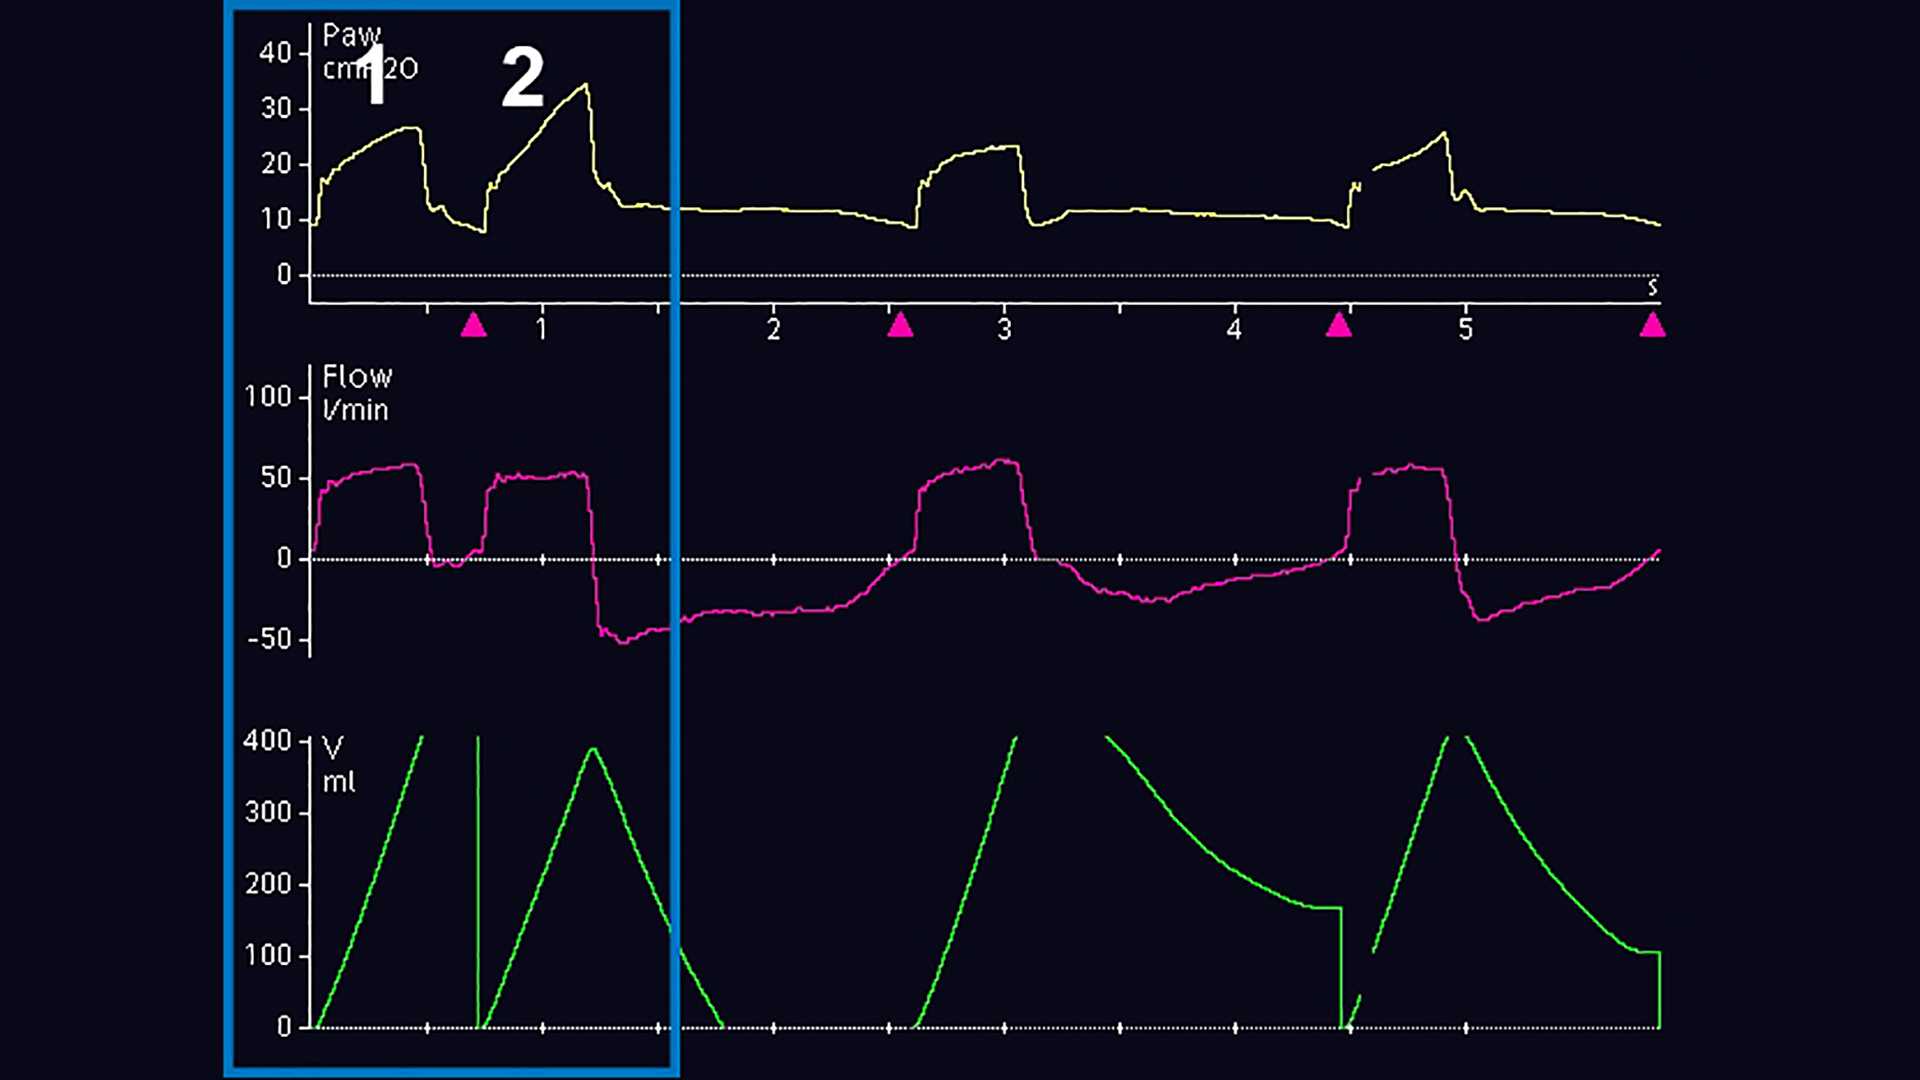
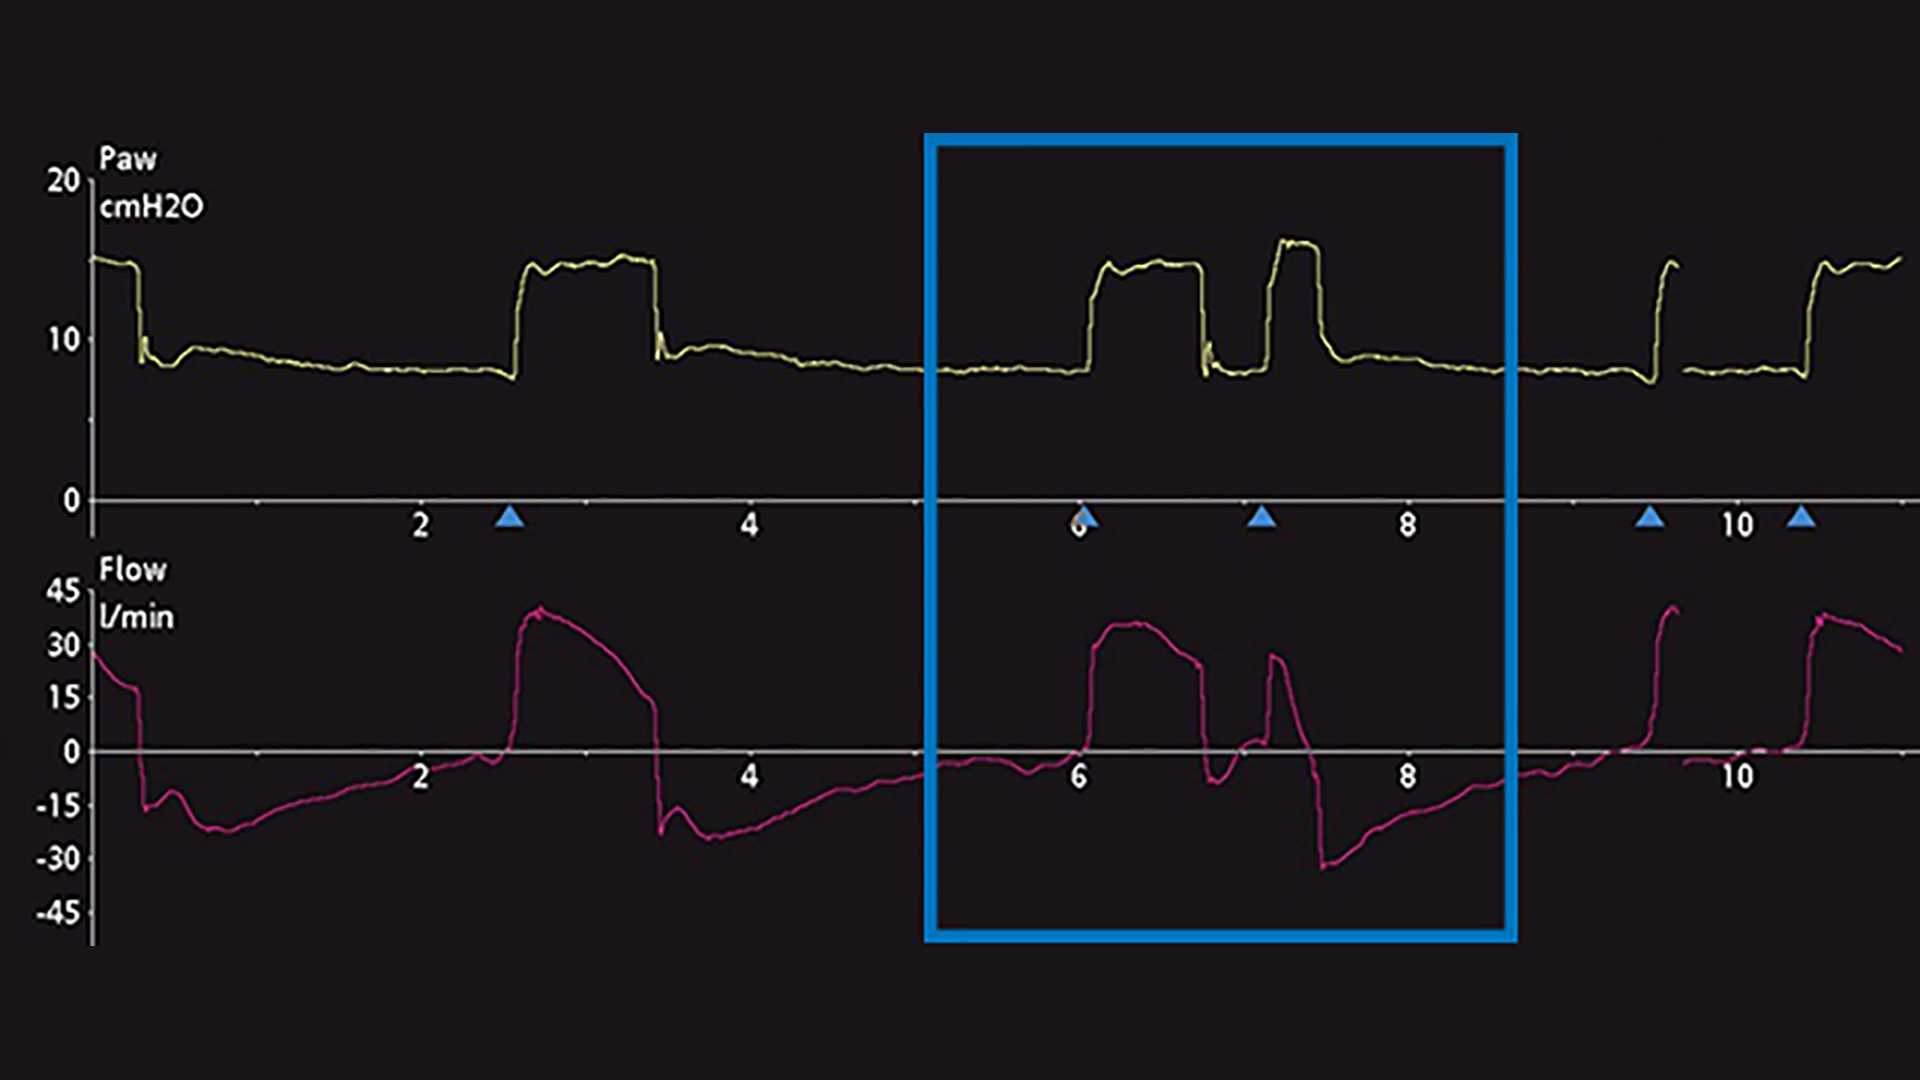
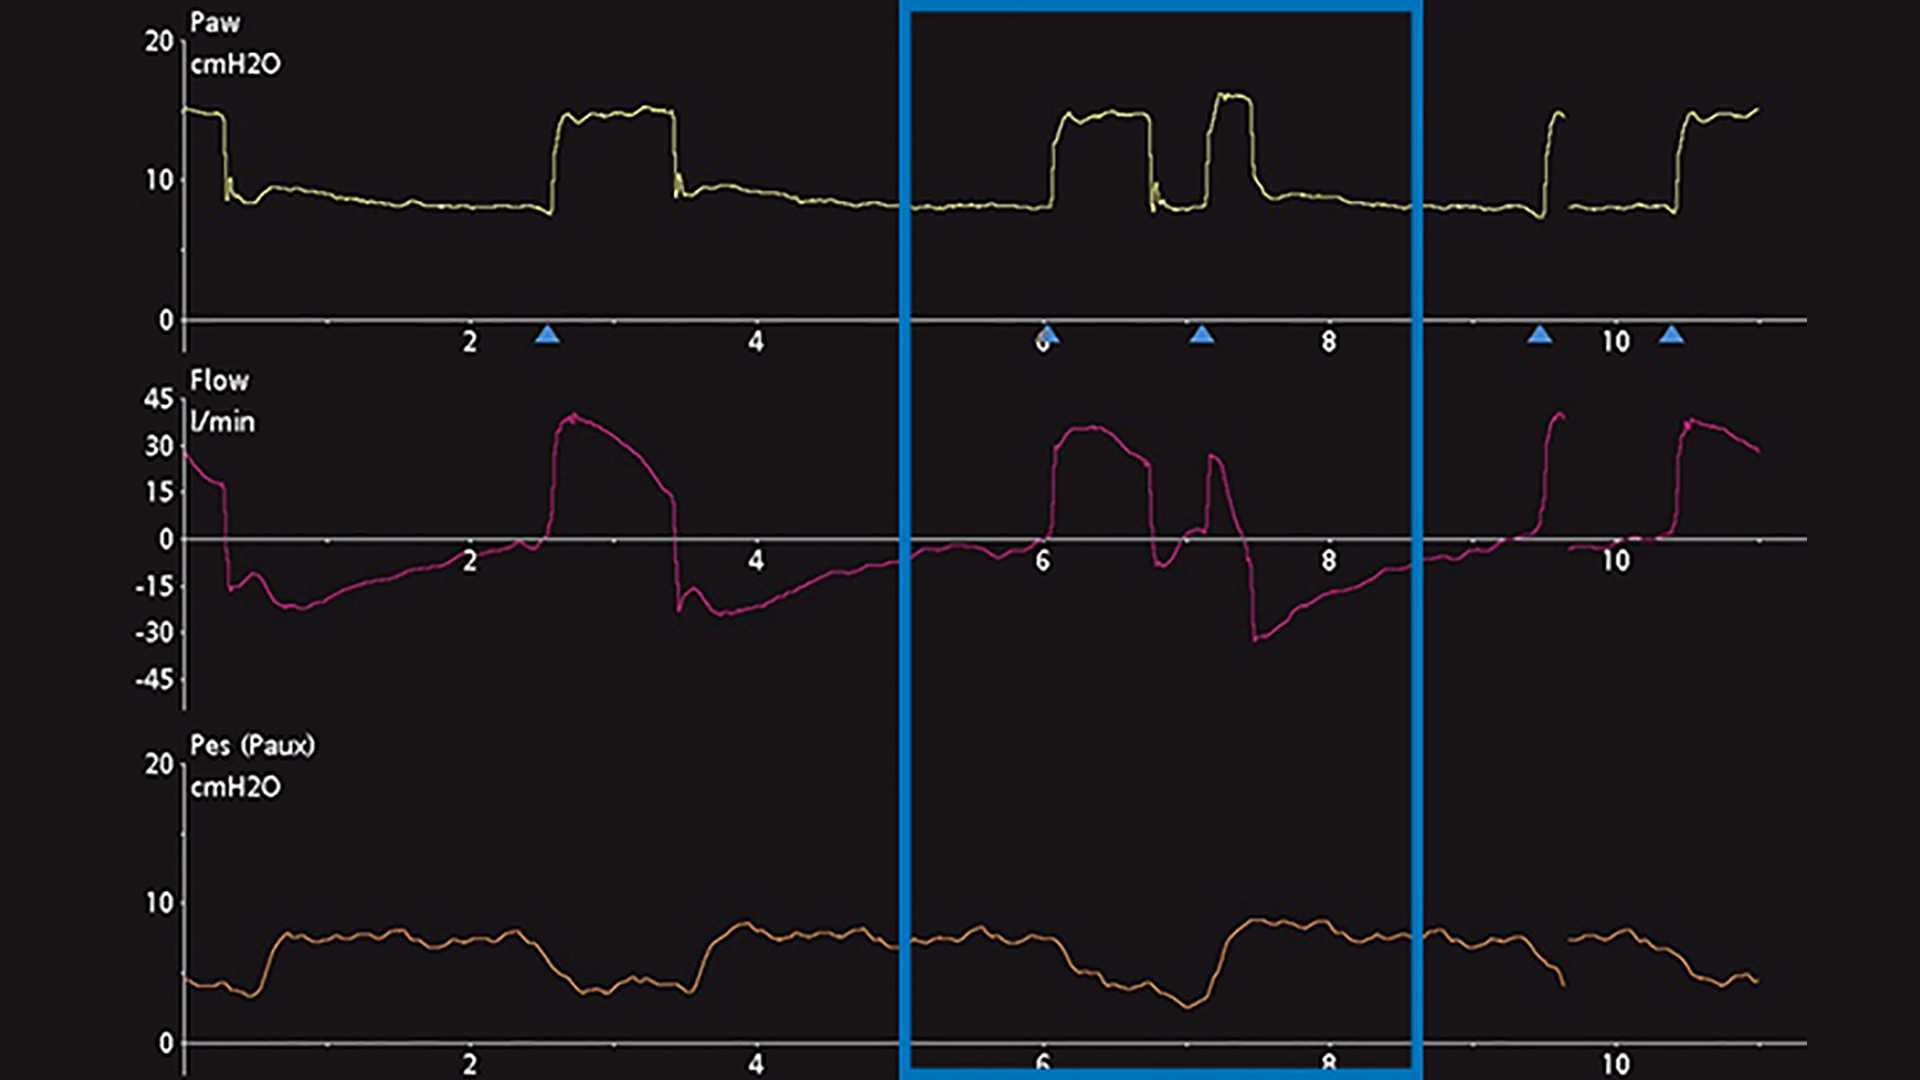
Il metodo principale per diagnosticare il doppio trigger, o DT, si basa sull'osservazione e la valutazione delle curve scalari del ventilatore. Una curva scalare è la visualizzazione di qualsiasi variabile in funzione del tempo. La maggior parte dei ventilatori meccanici consente normalmente di visualizzare l'andamento di pressione, flusso e/o volume nel tempo. Per agevolare ulteriormente l'analisi di queste curve, alcuni ventilatori consentono di visualizzare l'andamento temporale della pressione esofagea (che approssima la pressione pleurica). Per dimostrare la validità dei passaggi che permettono di identificare correttamente il DT, di seguito sono riportate alcune schermate con le curve visualizzate dal ventilatore. Nella Figura 1 sono visualizzate le normali curve di pressione, flusso e volume in cui è evidenziato il fenomeno del DT durante la ventilazione invasiva. Inizialmente, un occhio non allenato a riconoscerlo può non essere in grado di diagnosticare il fenomeno, né di individuare correttamente l'origine del problema. Spesso questa situazione viene scambiata per l'attivazione di un secondo respiro (respiro 2) da parte del paziente dopo l'erogazione di un respiro meccanico a tempo (respiro 1), oppure per "fame d'aria": questo errore può causare effetti avversi gravi legati alla ventilazione meccanica se questa prosegue senza che il problema venga risolto.  È quindi consigliabile un'analisi più attenta, che si può eseguire utilizzando la manometria esofagea per confrontare la pressione pleurica, la pressione delle vie aeree del ventilatore e le variazioni di flusso. In un altro esempio mostrato di seguito, in cui sul ventilatore sono visualizzate le curve scalari di pressione e flusso in funzione del tempo, è presente un indizio di potenziale DT, che può essere scambiato anche per un ulteriore sforzo inspiratorio attivo (Figura 2). Aggiungendo la curva scalare della pressione esofagea (curva Pes/Paux) è evidente che in realtà è presente un doppio trigger a causa dell'erogazione di respiri successivi durante un singolo sforzo inspiratorio attivo (notare la diminuzione della pressione pleurica visibile nella Figura 3).
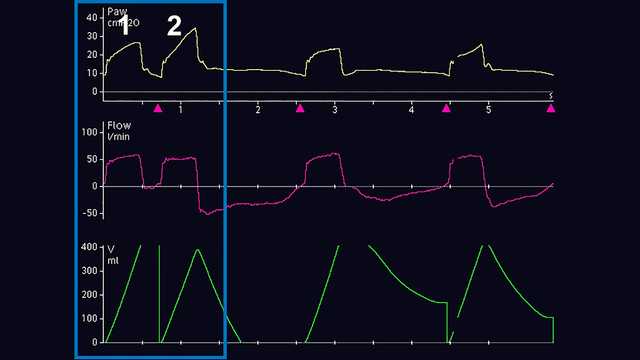
Curve di pressione, flusso e volume con doppio trigger
Figura 1
Curve di pressione, flusso e volume con doppio trigger
Figura 1
Curve di pressione e flusso con doppio trigger
Figura 2
Curve di pressione e flusso con doppio trigger
Figura 2
Curva della pressione esofagea con diminuzione della pressione pleurica
Figura 3
Curva della pressione esofagea con diminuzione della pressione pleurica
Figura 3

Distinzione

Anche distinguere e classificare il tipo di doppio trigger è complesso quando ci si trova al posto letto. La ricerca attuale suggerisce che sia possibile distinguere tre diversi tipi di DT (Liao KM, Ou CY, Chen CW. Classifying different types of double triggering based on airway pressure and flow deflection in mechanically ventilated patients. Respir Care. 2011;56(4):460-466. doi:10.4187/respcare.007312):

  • Innescato dal paziente (DT-P): il primo respiro innescato corrisponde a una diminuzione della pressione esofagea > 1 cmH2O e può essere associato a uno sforzo inspiratorio intenso
  • Con trigger automatico (DT-A): il primo respiro innescato si verifica prima del trigger a tempo impostato sul ventilatore e non si ha una diminuzione concomitante della pressione esofagea
  • Innescato dal ventilatore (DT-V): il primo respiro si verifica in corrispondenza del trigger a tempo impostato sul ventilatore e non si ha una diminuzione concomitante della pressione esofagea

I dati evidenziano che spesso è presente un ritardo del trigger di 0,07-0,13 secondi nella fase pre-inspiratoria (Takeuchi M, Williams P, Hess D, Kacmarek RM. Continuous positive airway pressure in new-generation mechanical ventilators: a lung model study. Anesthesiology. 2002;96(1):162-172. doi:10.1097/00000542-200201000-000305). La valutazione della diminuzione della pressione delle vie aere è uno strumento più potente rispetto alla variazione del flusso corrispondente alla fase di ritardo del trigger da 0,13 secondi (Liao KM, Ou CY, Chen CW. Classifying different types of double triggering based on airway pressure and flow deflection in mechanically ventilated patients. Respir Care. 2011;56(4):460-466. doi:10.4187/respcare.007312). La diminuzione di pressione > 0,49 cmH2O in questo punto può quindi permettere di distinguere tra i respiri DT-A e DT-V (Liao KM, Ou CY, Chen CW. Classifying different types of double triggering based on airway pressure and flow deflection in mechanically ventilated patients. Respir Care. 2011;56(4):460-466. doi:10.4187/respcare.007312). Ulteriori dati hanno evidenziato che il tempo inspiratorio neurale, che si può calcolare come il tratto che parte alla comparsa di una rapida diminuzione della pressione esofagea e va fino al valore minimo, era significativamente più lungo nel primo respiro DT-P rispetto ai respiri precedenti (Parthasarathy S, Jubran A, Tobin MJ. Assessment of neural inspiratory time in ventilator-supported patients. Am J Respir Crit Care Med. 2000;162(2 Pt 1):546-552. doi:10.1164/ajrccm.162.2.99010246). Le riduzioni della pressione delle vie aeree combinate con il calcolo del tempo inspiratorio neurale possono quindi agevolare l'identificazione del doppio trigger dovuto al paziente.

Risoluzione: IntelliSync+

Le cause più comuni di DT sono l'errata corrispondenza tra i tempi inspiratori dei respiri meccanici e i tempi inspiratori neurali, e un supporto di pressione insufficiente con drive respiratori elevati (Kallet RH, Campbell AR, Dicker RA, Katz JA, Mackersie RC. Effects of tidal volume on work of breathing during lung-protective ventilation in patients with acute lung injury and acute respiratory distress syndrome. Crit Care Med. 2006;34(1):8-14. doi:10.1097/01.ccm.0000194538.32158.af7). In particolare, il tempo inspiratorio dei respiri meccanici è troppo breve rispetto al più lungo tempo inspiratorio neurale. Il prolungamento del tempo inspiratorio dei respiri meccanici fino alla corrispondenza con il tempo inspiratorio neurale del paziente o l'aumento della pressione e del volume corrente erogati dal ventilatore può quindi ridurre al minimo o eliminare i DT (Vignaux L, Vargas F, Roeseler J, et al. Patient-ventilator asynchrony during non-invasive ventilation for acute respiratory failure: a multicenter study. Intensive Care Med. 2009;35(5):840-846. doi:10.1007/s00134-009-1416-58). Per fare questo, l'utente deve però essere presente al posto letto per osservare il fenomeno e intervenire manualmente sul ventilatore. È possibile automatizzare questa regolazione con la funzione IntelliSync+ (Non disponibile in tutti i mercatiA) presente sui ventilatori Hamilton Medical. IntelliSync+ osserva attentamente i criteri di ciclaggio in ogni respiro e regola il tempo inspiratorio in base alle esigenze del paziente. Questa opzione riduce il numero di asincronie aumentando il comfort del paziente e può avere un effetto positivo anche sugli esiti dei pazienti.

Note

  • A. Non disponibile in tutti i mercati

Bibliografia

  1. 1. Thille AW, Rodriguez P, Cabello B, Lellouche F, Brochard L. Patient-ventilator asynchrony during assisted mechanical ventilation. Intensive Care Med. 2006;32(10):1515-1522. doi:10.1007/s00134-006-0301-8
  2. 2. Liao KM, Ou CY, Chen CW. Classifying different types of double triggering based on airway pressure and flow deflection in mechanically ventilated patients. Respir Care. 2011;56(4):460-466. doi:10.4187/respcare.00731
  3. 3. Pohlman MC, McCallister KE, Schweickert WD, et al. Excessive tidal volume from breath stacking during lung-protective ventilation for acute lung injury. Crit Care Med. 2008;36(11):3019-3023. doi:10.1097/CCM.0b013e31818b308b
  4. 4. Colombo D, Cammarota G, Alemani M, et al. Efficacy of ventilator waveforms observation in detecting patient-ventilator asynchrony. Crit Care Med. 2011;39(11):2452-2457. doi:10.1097/CCM.0b013e318225753c
  5. 5. Takeuchi M, Williams P, Hess D, Kacmarek RM. Continuous positive airway pressure in new-generation mechanical ventilators: a lung model study. Anesthesiology. 2002;96(1):162-172. doi:10.1097/00000542-200201000-00030
  6. 6. Parthasarathy S, Jubran A, Tobin MJ. Assessment of neural inspiratory time in ventilator-supported patients. Am J Respir Crit Care Med. 2000;162(2 Pt 1):546-552. doi:10.1164/ajrccm.162.2.9901024
  7. 7. Kallet RH, Campbell AR, Dicker RA, Katz JA, Mackersie RC. Effects of tidal volume on work of breathing during lung-protective ventilation in patients with acute lung injury and acute respiratory distress syndrome. Crit Care Med. 2006;34(1):8-14. doi:10.1097/01.ccm.0000194538.32158.af
  8. 8. Vignaux L, Vargas F, Roeseler J, et al. Patient-ventilator asynchrony during non-invasive ventilation for acute respiratory failure: a multicenter study. Intensive Care Med. 2009;35(5):840-846. doi:10.1007/s00134-009-1416-5

Patient-ventilator asynchrony during assisted mechanical ventilation.

Thille AW, Rodriguez P, Cabello B, Lellouche F, Brochard L. Patient-ventilator asynchrony during assisted mechanical ventilation. Intensive Care Med. 2006;32(10):1515-1522. doi:10.1007/s00134-006-0301-8


OBJECTIVE

The incidence, pathophysiology, and consequences of patient-ventilator asynchrony are poorly known. We assessed the incidence of patient-ventilator asynchrony during assisted mechanical ventilation and we identified associated factors.

METHODS

Sixty-two consecutive patients requiring mechanical ventilation for more than 24 h were included prospectively as soon as they triggered all ventilator breaths: assist-control ventilation (ACV) in 11 and pressure-support ventilation (PSV) in 51.

MEASUREMENTS

Gross asynchrony detected visually on 30-min recordings of flow and airway pressure was quantified using an asynchrony index.

RESULTS

Fifteen patients (24%) had an asynchrony index greater than 10% of respiratory efforts. Ineffective triggering and double-triggering were the two main asynchrony patterns. Asynchrony existed during both ACV and PSV, with a median number of episodes per patient of 72 (range 13-215) vs. 16 (4-47) in 30 min, respectively (p=0.04). Double-triggering was more common during ACV than during PSV, but no difference was found for ineffective triggering. Ineffective triggering was associated with a less sensitive inspiratory trigger, higher level of pressure support (15 cmH(2)O, IQR 12-16, vs. 17.5, IQR 16-20), higher tidal volume, and higher pH. A high incidence of asynchrony was also associated with a longer duration of mechanical ventilation (7.5 days, IQR 3-20, vs. 25.5, IQR 9.5-42.5).

CONCLUSIONS

One-fourth of patients exhibit a high incidence of asynchrony during assisted ventilation. Such a high incidence is associated with a prolonged duration of mechanical ventilation. Patients with frequent ineffective triggering may receive excessive levels of ventilatory support.

Classifying different types of double triggering based on airway pressure and flow deflection in mechanically ventilated patients.

Liao KM, Ou CY, Chen CW. Classifying different types of double triggering based on airway pressure and flow deflection in mechanically ventilated patients. Respir Care. 2011;56(4):460-466. doi:10.4187/respcare.00731


BACKGROUND

Double-triggering (DT) is a frequent type of patient-ventilator asynchrony and has potentially severe consequences, such as alveolar overdistention or the generation of intrinsic PEEP. However, the first breath of DT could be patient-triggered (DT-P), auto-triggered (DT-A), or ventilator-triggered (DT-V).

OBJECTIVE

To differentiate DT-P, DT-A, and DT-V using airway pressure or flow changes during the trigger-delay phase in ventilated patients.

METHODS

Fourteen mechanically ventilated patients with DT were included. All patients were on flow-triggered ventilation modes and received either continuous mandatory ventilation or pressure support ventilation. Breaths in which the first breath was associated with an esophageal pressure drop of > 1 cm H(2)O were categorized as DT-P. Breaths in which the first breath occurred at the ventilator set cycle were categorized as DT-V. Breaths in which the first breath occurred earlier than the ventilator set cycle without esophageal pressure drop were categorized as DT-A. The pressure drop and flow change at 0.13 s (PD(0.13) and F(0.13), respectively) in the trigger-delay phase were calculated from the nadir.

RESULTS

There were 507 double-triggered breaths: 271 DT-V (53%), 50 DT-A (10%), and 186 DT-P (37%). The PD(0.13) for DT-V, DT-A, and DT-P were 0.16 ± 0.12 cm H(2)O, 0.25 ± 0.17 cm H(2)O, and 1.34 ± 0.67 cm H(2)O, respectively. The F(0.13) for DT-V, DT-A, and DT-P were 2.11 ± 2.31 L/min, 2.64 ± 2.07 L/min, and 16.51 ± 8.02 L/min, respectively. The best discriminatory criteria for differentiating DT-P from DT-V and DT-A, based on the Youden index (sensitivity + specificity - 1) was PD(0.13) ≥ 0.49 cm H(2)O, which had a Youden index of 95%.

CONCLUSION

DT-P can be distinguished from DT-V and DT-A by using airway pressure deflections in the trigger-delay phase.

Excessive tidal volume from breath stacking during lung-protective ventilation for acute lung injury.

Pohlman MC, McCallister KE, Schweickert WD, et al. Excessive tidal volume from breath stacking during lung-protective ventilation for acute lung injury. Crit Care Med. 2008;36(11):3019-3023. doi:10.1097/CCM.0b013e31818b308b


RATIONALE

Low tidal volume ventilation strategies for patients with respiratory failure from acute lung injury may lead to breath stacking and higher volumes than intended.

OBJECTIVE

To determine frequency, risk factors, and volume of stacked breaths during low tidal volume ventilation for acute lung injury.

DESIGN, SETTING, AND PATIENTS

Prospective cohort study of mechanically ventilated patients with acute lung injury (enrolled from August 2006 through May 2007) treated with low tidal volume ventilation in a medical intensive care unit at an academic tertiary care hospital.

INTERVENTIONS

Patients were ventilated with low tidal volumes using the Acute Respiratory Distress Syndrome Network protocol for acute lung injury. Continuous flow-time and pressure-time waveforms were recorded. The frequency, risk factors, and volume of stacked breaths were determined. Sedation depth was monitored using Richmond agitation sedation scale.

MEASUREMENTS AND MAIN RESULTS

Twenty patients were enrolled and studied for a mean 3.3 +/- 1.7 days. The median (interquartile range) Richmond agitation sedation scale was -4 (-5, -3). Inter-rater agreement for identifying stacked breaths was high (kappa 0.99, 95% confidence interval 0.98-0.99). Stacked breaths occurred at a mean 2.3 +/- 3.5 per minute and resulted in median volumes of 10.1 (8.8-10.7) mL/kg predicted body weight, which was 1.62 (1.44-1.82) times the set tidal volume. Stacked breaths were significantly less common with higher set tidal volumes (relative risk 0.4 for 1 mL/kg predicted body weight increase in tidal volume, 95% confidence interval 0.23-0.90).

CONCLUSION

Stacked breaths occur frequently in low tidal volume ventilation despite deep sedation and result in volumes substantially above the set tidal volume. Set tidal volume has a strong influence on frequency of stacked breaths.

Efficacy of ventilator waveforms observation in detecting patient-ventilator asynchrony.

Colombo D, Cammarota G, Alemani M, et al. Efficacy of ventilator waveforms observation in detecting patient-ventilator asynchrony. Crit Care Med. 2011;39(11):2452-2457. doi:10.1097/CCM.0b013e318225753c


OBJECTIVES

The value of visual inspection of ventilator waveforms in detecting patient-ventilator asynchronies in the intensive care unit has never been systematically evaluated. This study aims to assess intensive care unit physicians' ability to identify patient-ventilator asynchronies through ventilator waveforms.

DESIGN

Prospective observational study.

SETTING

Intensive care unit of a University Hospital.

PATIENTS

Twenty-four patients receiving mechanical ventilation for acute respiratory failure.

INTERVENTION

Forty-three 5-min reports displaying flow-time and airway pressure-time tracings were evaluated by 10 expert and 10 nonexpert, i.e., residents, intensive care unit physicians. The asynchronies identified by experts and nonexperts were compared with those ascertained by three independent examiners who evaluated the same reports displaying, additionally, tracings of diaphragm electrical activity.

MEASUREMENTS AND MAIN RESULTS

Data were examined according to both breath-by-breath analysis and overall report analysis. Sensitivity, specificity, and positive and negative predictive values were determined. Sensitivity and positive predictive value were very low with breath-by-breath analysis (22% and 32%, respectively) and fairly increased with report analysis (55% and 44%, respectively). Conversely, specificity and negative predictive value were high with breath-by-breath analysis (91% and 86%, respectively) and slightly lower with report analysis (76% and 82%, respectively). Sensitivity was significantly higher for experts than for nonexperts for breath-by-breath analysis (28% vs. 16%, p < .05), but not for report analysis (63% vs. 46%, p = .15). The prevalence of asynchronies increased at higher ventilator assistance and tidal volumes (p < .001 for both), whereas it decreased at higher respiratory rates and diaphragm electrical activity (p < .001 for both). At higher prevalence, sensitivity decreased significantly (p < .001).

CONCLUSIONS

The ability of intensive care unit physicians to recognize patient-ventilator asynchronies was overall quite low and decreased at higher prevalence; expertise significantly increased sensitivity for breath-by-breath analysis, whereas it only produced a trend toward improvement for report analysis.

Continuous positive airway pressure in new-generation mechanical ventilators: a lung model study.

Takeuchi M, Williams P, Hess D, Kacmarek RM. Continuous positive airway pressure in new-generation mechanical ventilators: a lung model study. Anesthesiology. 2002;96(1):162-172. doi:10.1097/00000542-200201000-00030


BACKGROUND

A number of new microprocessor-controlled mechanical ventilators have become available over the last few years. However, the ability of these ventilators to provide continuous positive airway pressure without imposing or performing work has never been evaluated.

METHODS

In a spontaneously breathing lung model, the authors evaluated the Bear 1000, Drager Evita 4, Hamilton Galileo, Nellcor-Puritan-Bennett 740 and 840, Siemens Servo 300A, and Bird Products Tbird AVS at 10 cm H(2)O continuous positive airway pressure. Lung model compliance was 50 ml/cm H(2)O with a resistance of 8.2 cm H(2)O x l(-1) x s(-1), and inspiratory time was set at 1.0 s with peak inspiratory flows of 40, 60, and 80 l/min. In ventilators with both pressure and flow triggering, the response of each was evaluated.

RESULTS

With all ventilators, peak inspiratory flow, lung model tidal volume, and range of pressure change (below baseline to above baseline) increased as peak flow increased. Inspiratory trigger delay time, inspiratory cycle delay time, expiratory pressure time product, and total area of pressure change were not affected by peak flow, whereas pressure change to trigger inspiration, inspiratory pressure time product, and trigger pressure time product were affected by peak flow on some ventilators. There were significant differences among ventilators on all variables evaluated, but there was little difference between pressure and flow triggering in most variables on individual ventilators except for pressure to trigger. Pressure to trigger was 3.74 +/- 1.89 cm H(2)O (mean +/- SD) in flow triggering and 4.48 +/- 1.67 cm H(2)O in pressure triggering (P < 0.01) across all ventilators.

CONCLUSIONS

Most ventilators evaluated only imposed a small effort to trigger, but most also provided low-level pressure support and imposed an expiratory workload. Pressure triggering during continuous positive airway pressure does require a slightly greater pressure than flow triggering.

Assessment of neural inspiratory time in ventilator-supported patients.

Parthasarathy S, Jubran A, Tobin MJ. Assessment of neural inspiratory time in ventilator-supported patients. Am J Respir Crit Care Med. 2000;162(2 Pt 1):546-552. doi:10.1164/ajrccm.162.2.9901024

Neural inspiratory time (TI) is a measurement of fundamental importance in studies of patient-ventilator interaction. The measurement is usually based on recordings of flow, esophageal pressure (Pes), and transdiaphragmatic pressure (Pdi), but the concordance of such estimates of neural TI with a more direct measurement of neural activity has not been systematically evaluated. To address this issue, we studied nine ventilator-supported patients in whom we employed esophageal electrode recordings of the diaphragmatic electromyogram (EMG) as the reference measurement of neural TI. Comparison of the indirect estimates of neural TI duration, based on flow, Pes, and Pdi against the reference measurement, revealed a mean difference (bias) ranging from -54 to 612 ms during spontaneous breathing and from -52 to 714 ms during mechanical ventilation; the respective precisions (standard deviations of the differences) ranged from 79 to 175 ms and from 74 to 221 ms. Because an indirect estimate of neural TI duration could be identical to that of the reference measurement and yet be displaced in time, this lag or lead was quantified as the phase angle of neural TI onset. Flow-based estimates of the onset of neural TI displayed a systematic lag, which may be explained at least in part by concurrent intrinsic positive end-expiratory pressure. In conclusion, the indirect estimates of the onset and duration of neural TI in ventilator-dependent patients displayed poor agreement with the diaphragmatic EMG measurement of neural TI.

Effects of tidal volume on work of breathing during lung-protective ventilation in patients with acute lung injury and acute respiratory distress syndrome.

Kallet RH, Campbell AR, Dicker RA, Katz JA, Mackersie RC. Effects of tidal volume on work of breathing during lung-protective ventilation in patients with acute lung injury and acute respiratory distress syndrome. Crit Care Med. 2006;34(1):8-14. doi:10.1097/01.ccm.0000194538.32158.af


OBJECTIVE

To assess the effects of step-changes in tidal volume on work of breathing during lung-protective ventilation in patients with acute lung injury (ALI) or the acute respiratory distress syndrome (ARDS).

DESIGN

Prospective, nonconsecutive patients with ALI/ARDS.

SETTING

Adult surgical, trauma, and medical intensive care units at a major inner-city, university-affiliated hospital.

PATIENTS

Ten patients with ALI/ARDS managed clinically with lung-protective ventilation.

INTERVENTIONS

Five patients were ventilated at a progressively smaller tidal volume in 1 mL/kg steps between 8 and 5 mL/kg; five other patients were ventilated at a progressively larger tidal volume from 5 to 8 mL/kg. The volume mode was used with a flow rate of 75 L/min. Minute ventilation was maintained constant at each tidal volume setting. Afterward, patients were placed on continuous positive airway pressure for 1-2 mins to measure their spontaneous tidal volume.

MEASUREMENTS AND MAIN RESULTS

Work of breathing and other variables were measured with a pulmonary mechanics monitor (Bicore CP-100). Work of breathing progressively increased (0.86 +/- 0.32, 1.05 +/- 0.40, 1.22 +/- 0.36, and 1.57 +/- 0.43 J/L) at a tidal volume of 8, 7, 6, and 5 mL/kg, respectively. In nine of ten patients there was a strong negative correlation between work of breathing and the ventilator-to-patient tidal volume difference (R = -.75 to -.998).

CONCLUSIONS

: The ventilator-delivered tidal volume exerts an independent influence on work of breathing during lung-protective ventilation in patients with ALI/ARDS. Patient work of breathing is inversely related to the difference between the ventilator-delivered tidal volume and patient-generated tidal volume during a brief trial of unassisted breathing.

Patient-ventilator asynchrony during non-invasive ventilation for acute respiratory failure: a multicenter study.

Vignaux L, Vargas F, Roeseler J, et al. Patient-ventilator asynchrony during non-invasive ventilation for acute respiratory failure: a multicenter study. Intensive Care Med. 2009;35(5):840-846. doi:10.1007/s00134-009-1416-5


OBJECTIVE

To determine the prevalence of patient-ventilator asynchrony in patients receiving non-invasive ventilation (NIV) for acute respiratory failure.

DESIGN

Prospective multicenter observation study.

SETTING

Intensive care units in three university hospitals.

METHODS

Patients consecutively admitted to ICU were included. NIV, performed with an ICU ventilator, was set by the clinician. Airway pressure, flow, and surface diaphragmatic electromyography were recorded continuously for 30 min. Asynchrony events and the asynchrony index (AI) were determined from visual inspection of the recordings and clinical observation.

RESULTS

A total of 60 patients were included, 55% of whom were hypercapnic. Auto-triggering was present in 8 (13%) patients, double triggering in 9 (15%), ineffective breaths in 8 (13%), premature cycling 7 (12%) and late cycling in 14 (23%). An AI > 10%, indicating severe asynchrony, was present in 26 patients (43%), whose median (25-75 IQR) AI was 26 (15-54%). A significant correlation was found between the magnitude of leaks and the number of ineffective breaths and severity of delayed cycling. Multivariate analysis indicated that the level of pressure support and the magnitude of leaks were weakly, albeit significantly, associated with an AI > 10%. Patient comfort scale was higher in pts with an AI < 10%.

CONCLUSION

Patient-ventilator asynchrony is common in patients receiving NIV for acute respiratory failure. Our results suggest that leaks play a major role in generating patient-ventilator asynchrony and discomfort, and point the way to further research to determine if ventilator functions designed to cope with leaks can reduce asynchrony in the clinical setting.

Related articles. Get a deeper look