Назад

Механическая мощность и вентилятор‑индуцированное повреждение легких

Статья

Автор: Жан‑Пьер Ревелли (Jean‑Pierre Revelly), Джорджио Иотти (Giorgio Iotti)

Дата: 03.04.2023

В этой статье более подробно рассматриваются различные компоненты механической мощности, их значение в клинических условиях и использование в качестве мониторируемых параметров.

Механическая мощность и вентилятор-индуцированное повреждение легких

В этой статье рассматривается только механическая мощность (MP) во время фазы вдоха при искусственной вентиляции при условии отсутствия дыхательного усилия пациента.

В физике: 

  • механическая работа ‑ это энергия, которая передается на объект (или от него) посредством приложения силы при перемещении из одного положения в другое.
  • Мощность ‑ это количество энергии, переданной за единицу времени.

При механической вентиляции мощность, передаваемая от аппарата ИВЛ к дыхательной системе во время вдоха, представляет собой комплексную переменную, объединяющую элементы, которые могут вызывать вентилятор‑индуцированное повреждение легких (ВИПЛ) (Gattinoni L, Tonetti T, Cressoni M, et al. Ventilator-related causes of lung injury: the mechanical power. Intensive Care Med. 2016;42(10):1567-1575. doi:10.1007/s00134-016-4505-21​).

Механическая мощность в режиме CMV

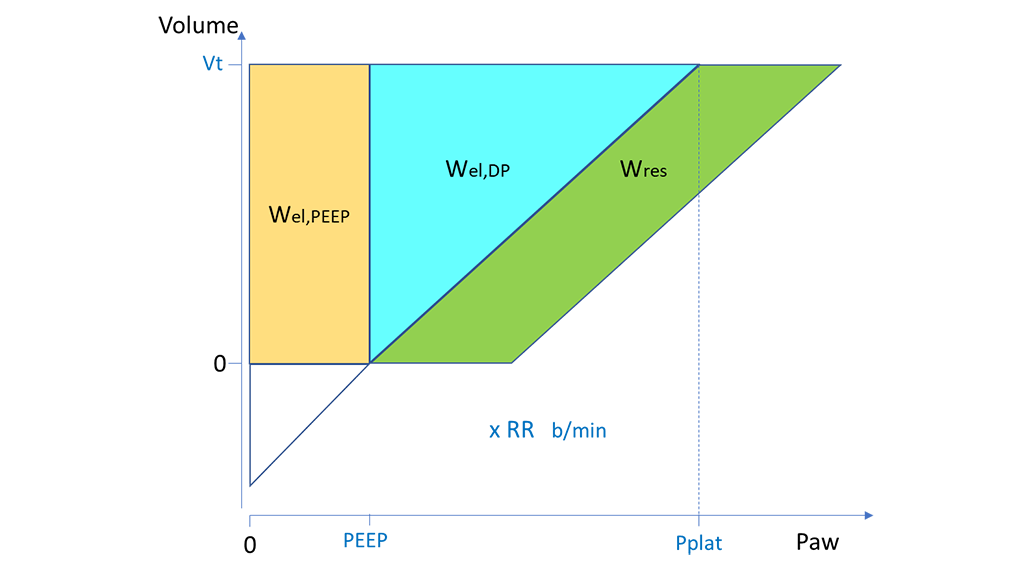
Во время управляемой принудительной вентиляции (CMV) с постоянным потоком механическую мощность можно описать как работу за один вдох (W), умноженную на частоту дыхания (RR) (рис. 1). (Costa ELV, Slutsky AS, Brochard LJ, et al. Ventilatory Variables and Mechanical Power in Patients with Acute Respiratory Distress Syndrome. Am J Respir Crit Care Med. 2021;204(3):303‑311. doi:10.1164/rccm.202009‑3467OC2​):

Где:

  • Показатель «Wel,PEEP» представляет собой гибкий статический компонент, т. е. компонент механической мощности, связанный с параметром «PEEP». 
  • Показатель «Wel,DP» представляет собой (дыхательный) гибкий динамический компонент, т. е. компонент механической мощности, связанный с дыхательной инфляцией. Он имеет форму прямоугольного треугольника, вертикальная сторона которого соответствует дыхательному объему («Vt»), а горизонтальная ‑ рабочему давлению («DP»). Наклон третьей стороны соответствует податливости. 
  • «Wres» ‑ это резистивный компонент, т. е. энергия, рассеиваемая при каждом вдохе для преодоления сопротивления и вязкости составляющих дыхательной системы. «Wres» представляет собой параллелограмм, основание которого соответствует разнице между пиковым давлением («Pпик») и давлением плато («Pплато»), а высота ‑ показателю «Vt».
Диаграмма, на которой представлены три различных компонента механической мощности
Рисунок 1. Диаграмма «давление ‑ объем», на которой представлены три различных компонента механической мощности (пояснение см. в тексте)

Механическая мощность в режиме PCV

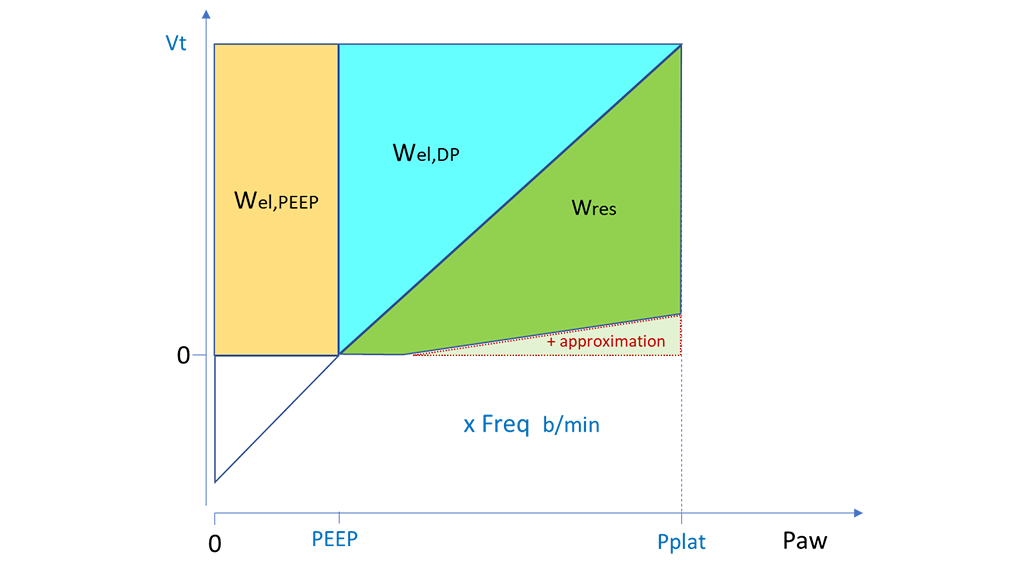
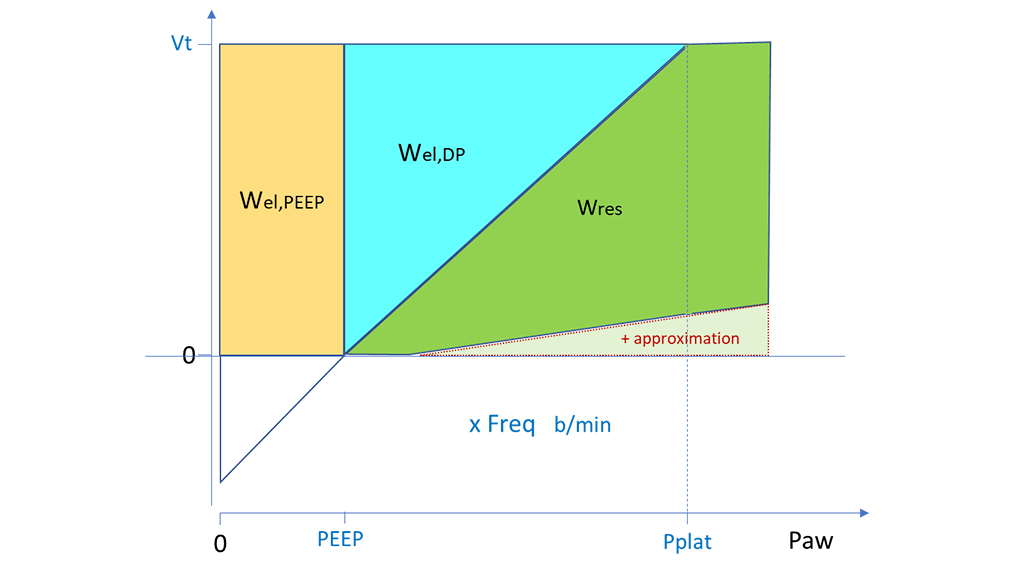
Аналогичный подход можно применять во время вентиляции с управлением по давлению (PCV) для расчета значений «Wel,PEEP» и «Wel,DP» на основе показателей «Vt», «PEEP» и «DP». Значение «Wres» можно рассчитать приблизительно. Для этого следует вычислить площадь прямоугольника (с «Pпик» минус «PEEP» в качестве основания и «Vt» в качестве высоты), а затем вычесть треугольник, соответствующий «Wel,DP». Этот расчет значения «Wres» можно применять таким же образом, когда значение «Pпик» равно значению «Pплато» (рис. 2) или превышает его (рис. 3), т. е. когда поток в конце вдоха равен нулю или, соответственно, все еще имеет положительное значение. В обоих случаях приблизительный расчет приводит к небольшому завышению значения «Wres» и, следовательно, истинного значения полной работы аппарата ИВЛ (Becher T, van der Staay M, Schädler D, Frerichs I, Weiler N. Calculation of mechanical power for pressure‑controlled ventilation. Intensive Care Med. 2019;45(9):1321‑1323. doi:10.1007/s00134‑019‑05636‑83​).

Схема приблизительного расчета, когда значение «Pпик» равно значению «Pплато»
Рисунок 2. Приблизительный расчет значения «Wres» в режиме PCV, когда значение «Pпик» равно значению «Pплато»
Схема приблизительного расчета, когда значение «Pпик» превышает значение «Pплато»
Рисунок 3. Приблизительный расчет значения «Wres» в режиме PCV, когда значение «Pпик» превышает значение «Pплато»

Является ли механическая мощность важной с клинической точки зрения?

Значительное количество исследователей рассчитывали механическую мощность по данным исследований вентиляции у находящихся в отделениях интенсивной терапии пациентов с (Costa ELV, Slutsky AS, Brochard LJ, et al. Ventilatory Variables and Mechanical Power in Patients with Acute Respiratory Distress Syndrome. Am J Respir Crit Care Med. 2021;204(3):303‑311. doi:10.1164/rccm.202009‑3467OC2​, Tonna JE, Peltan I, Brown SM, Herrick JS, Keenan HT; University of Utah Mechanical Power Study Group. Mechanical power and driving pressure as predictors of mortality among patients with ARDS. Intensive Care Med. 2020;46(10):1941‑1943. doi:10.1007/s00134‑020‑06130‑24​, Robba C, Badenes R, Battaglini D, et al. Ventilatory settings in the initial 72 h and their association with outcome in out‑of‑hospital cardiac arrest patients: a preplanned secondary analysis of the targeted hypothermia versus targeted normothermia after out‑of‑hospital cardiac arrest (TTM2) trial. Intensive Care Med. 2022;48(8):1024‑1038. doi:10.1007/s00134‑022‑06756‑45) острым респираторным дистресс‑синдромом (ОРДС) или без него (Serpa Neto A, Deliberato RO, Johnson AEW, et al. Mechanical power of ventilation is associated with mortality in critically ill patients: an analysis of patients in two observational cohorts. Intensive Care Med. 2018;44(11):1914-1922. doi:10.1007/s00134-018-5375-66​​, Robba C, Badenes R, Battaglini D, et al. Ventilatory settings in the initial 72 h and their association with outcome in out-of-hospital cardiac arrest patients: a preplanned secondary analysis of the targeted hypothermia versus targeted normothermia after out-of-hospital cardiac arrest (TTM2) trial. Intensive Care Med. 2022;48(8):1024-1038. doi:10.1007/s00134-022-06756-47​, van Meenen DMP, Algera AG, Schuijt MTU, et al. Effect of mechanical power on mortality in invasively ventilated ICU patients without the acute respiratory distress syndrome: An analysis of three randomised clinical trials. Eur J Anaesthesiol. 2023;40(1):21-28. doi:10.1097/EJA.00000000000017788​). 
Ниже приведены данные из этих аналитических материалов. 

  • К пациентам, которые не выжили впоследствии, применялась значительно большая механическая мощность, чем к выжившим.
  • Увеличение механической мощности статистически соответствовало показателям смертности в отделении интенсивной терапии и стационаре, меньшему количеству дней без ИВЛ и увеличению продолжительности пребывания в отделении интенсивной терапии и стационаре. 

В целом эти ретроспективные исследования дают основание считать, что чрезмерной механической мощности предпочтительно избегать, если предположить, что худший клинический исход был частично связан с вентилятор‑индуцированным повреждением легких.

Существует ли значение механической мощности, безопасное для всех пациентов?

Чтобы правильно понять методы расчета механической мощности, использованные в опубликованных исследованиях, их необходимо тщательно изучить. В зависимости от имеющихся данных авторы могли учесть или исключить некоторые компоненты механической мощности. Кроме того, наиболее подходящая процедура для сравнения разных пациентов все еще является предметом обсуждения. Предлагается стандартизировать параметры пациента (прогнозируемый вес), податливость или объем легких в конце выдоха. 

В принципе, в настоящее время еще не существует ни стандартизированного подхода к расчету механической мощности, ни ее общепризнанного безопасного расчетного значения.

Возможен ли постоянный мониторинг механической мощности?

Отдельные изменения параметров аппарата ИВЛ оказывают сложное влияние на другие переменные механики вентиляции. Концепция механической мощности основана на неявном допущении того, что все переменные вентиляции имеют линейное соотношение и одинаковую связь с ВИПЛ. Однако это, очевидно, ошибочное предположение, поскольку, например, параметр «PEEP» имеет криволинейную (J‑образную) связь с ВИПЛ (Costa ELV, Slutsky AS, Brochard LJ, et al. Ventilatory Variables and Mechanical Power in Patients with Acute Respiratory Distress Syndrome. Am J Respir Crit Care Med. 2021;204(3):303-311. doi:10.1164/rccm.202009-3467OC2​). Во время вдоха, вероятно, существует безопасный объем, пороговое значение и опасная зона, которые не должны быть достигнуты (Marini JJ, Rocco PRM. Which component of mechanical power is most important in causing VILI?. Crit Care. 2020;24(1):39. Published 2020 Feb 5. doi:10.1186/s13054-020-2747-49). Паттерн инспираторного потока, который не учитывается в механической мощности, может играть существенную роль в ВИПЛ (Marini JJ, Crooke PS, Gattinoni L. Intra-cycle power: is the flow profile a neglected component of lung protection?. Intensive Care Med. 2021;47(5):609-611. doi:10.1007/s00134-021-06375-510​). 

Несмотря на то, что многие вопросы остаются открытыми, мониторинг общей механической мощности и ее компонентов может оказаться полезным для оценки динамики отдельных пациентов или их реакции на изменения параметров вентиляции. Механическая мощность может стать новым критерием (наряду с несколькими другими) в клинической оценке и принятии решений. Более того, мониторинг механической мощности в значительной степени поможет в сборе высококачественных данных для всех проспективных исследований взаимосвязи между механической мощностью и ВИПЛ. 

Итак, как можно снизить риск ВИПЛ с помощью настроек аппарата ИВЛ?

Различные исследователи делали попытки выявить наиболее вредные компоненты вентиляции. В ретроспективном исследовании были собраны данные об ИВЛ у 4500 пациентов с ОРДС, включенных в контролируемые исследования. В процессе исследования оценивалась взаимосвязь механической мощности, показателей «Vt», «RR» и «DP» со смертностью в течение 28 дней, для чего использовались многопараметрические модели (Costa ELV, Slutsky AS, Brochard LJ, et al. Ventilatory Variables and Mechanical Power in Patients with Acute Respiratory Distress Syndrome. Am J Respir Crit Care Med. 2021;204(3):303‑311. doi:10.1164/rccm.202009‑3467OC2​). Рабочее давление («DP») представляет собой дыхательный объем («Vt»), стандартизированный для податливости, и многими рассматривается как ключевой компонент ВИПЛ (Amato MB, Meade MO, Slutsky AS, et al. Driving pressure and survival in the acute respiratory distress syndrome. N Engl J Med. 2015;372(8):747‑755. doi:10.1056/NEJMsa141063911​).

Неудивительно, что авторы выявили связь общей механической мощности со смертностью. При оценке различных компонентов механической мощности статистически значимым был только гибкий динамический компонент («MPel,DP», т. е. механическая мощность, которая зависит от показателя «Wel,DP»), а компоненты, зависящие от показателя «PEEP» или сопротивления, ‑ не были. Значение «MPel,DP» особенно легко рассчитать у постели больного в обоих режимах: CMV и PCV.

  • MPel,DP = Vt x DP x RR / 2

Более того, авторы обнаружили аналогичный прогноз смертности, просто объединив показатели «DP» и «RR» в следующем индексе:

  • 4DP+индекс RR = (4 x DP) + RR

Авторы пришли к выводу, что «хотя механическая мощность была связана со смертностью у пациентов с ОРДС, показатели «∆P» и «RR» были столь же информативны, их было легче оценить у постели больного. Влияние стратегии вентиляции, основанной на этих переменных, на исход заболевания необходимо проверить в рандомизированных контролируемых исследованиях» (Costa ELV, Slutsky AS, Brochard LJ, et al. Ventilatory Variables and Mechanical Power in Patients with Acute Respiratory Distress Syndrome. Am J Respir Crit Care Med. 2021;204(3):303‑311. doi:10.1164/rccm.202009‑3467OC2​).

Сноски

Список литературы

  1. 1. Gattinoni L, Tonetti T, Cressoni M, et al. Ventilator‑related causes of lung injury: the mechanical power. Intensive Care Med. 2016;42(10):1567‑1575. doi:10.1007/s00134‑016‑4505‑2
  2. 2. Costa ELV, Slutsky AS, Brochard LJ, et al. Ventilatory Variables and Mechanical Power in Patients with Acute Respiratory Distress Syndrome. Am J Respir Crit Care Med. 2021;204(3):303‑311. doi:10.1164/rccm.202009‑3467OC
  3. 3. Becher T, van der Staay M, Schädler D, Frerichs I, Weiler N. Calculation of mechanical power for pressure‑controlled ventilation. Intensive Care Med. 2019;45(9):1321‑1323. doi:10.1007/s00134‑019‑05636‑8
  4. 4. Tonna JE, Peltan I, Brown SM, Herrick JS, Keenan HT; University of Utah Mechanical Power Study Group. Mechanical power and driving pressure as predictors of mortality among patients with ARDS. Intensive Care Med. 2020;46(10):1941‑1943. doi:10.1007/s00134‑020‑06130‑2
  5. 5. Coppola S, Caccioppola A, Froio S, et al. Effect of mechanical power on intensive care mortality in ARDS patients. Crit Care. 2020;24(1):246. Published 2020 May 24. doi:10.1186/s13054‑020‑02963‑x
  6. 6. Serpa Neto A, Deliberato RO, Johnson AEW, et al. Mechanical power of ventilation is associated with mortality in critically ill patients: an analysis of patients in two observational cohorts. Intensive Care Med. 2018;44(11):1914‑1922. doi:10.1007/s00134‑018‑5375‑6
  7. 7. Robba C, Badenes R, Battaglini D, et al. Ventilatory settings in the initial 72 h and their association with outcome in out‑of‑hospital cardiac arrest patients: a preplanned secondary analysis of the targeted hypothermia versus targeted normothermia after out‑of‑hospital cardiac arrest (TTM2) trial. Intensive Care Med. 2022;48(8):1024‑1038. doi:10.1007/s00134‑022‑06756‑4
  8. 8. van Meenen DMP, Algera AG, Schuijt MTU, et al. Effect of mechanical power on mortality in invasively ventilated ICU patients without the acute respiratory distress syndrome: An analysis of three randomised clinical trials. Eur J Anaesthesiol. 2023;40(1):21‑28. doi:10.1097/EJA.0000000000001778
  9. 9. Marini JJ, Rocco PRM. Which component of mechanical power is most important in causing VILI?. Crit Care. 2020;24(1):39. Published 2020 Feb 5. doi:10.1186/s13054‑020‑2747‑4
  10. 10. Marini JJ, Crooke PS, Gattinoni L. Intra‑cycle power: is the flow profile a neglected component of lung protection?. Intensive Care Med. 2021;47(5):609‑611. doi:10.1007/s00134‑021‑06375‑5
  11. 11. Amato MB, Meade MO, Slutsky AS, et al. Driving pressure and survival in the acute respiratory distress syndrome. N Engl J Med. 2015;372(8):747‑755. doi:10.1056/NEJMsa1410639
Диаграмма, на которой представлены три различных компонента механической мощности
Рисунок 1. Диаграмма «давление ‑ объем», на которой представлены три различных компонента механической мощности (пояснение см. в тексте)
Схема приблизительного расчета, когда значение «Pпик» равно значению «Pплато»
Рисунок 2. Приблизительный расчет значения «Wres» в режиме PCV, когда значение «Pпик» равно значению «Pплато»
Схема приблизительного расчета, когда значение «Pпик» превышает значение «Pплато»
Рисунок 3. Приблизительный расчет значения «Wres» в режиме PCV, когда значение «Pпик» превышает значение «Pплато»

Ventilator‑related causes of lung injury: the mechanical power.

Gattinoni L, Tonetti T, Cressoni M, et al. Ventilator‑related causes of lung injury: the mechanical power. Intensive Care Med. 2016;42(10):1567‑1575. doi:10.1007/s00134‑016‑4505‑2


PURPOSE

We hypothesized that the ventilator‑related causes of lung injury may be unified in a single variable: the mechanical power. We assessed whether the mechanical power measured by the pressure‑volume loops can be computed from its components: tidal volume (TV)/driving pressure (∆P aw), flow, positive end‑expiratory pressure (PEEP), and respiratory rate (RR). If so, the relative contributions of each variable to the mechanical power can be estimated.

METHODS

We computed the mechanical power by multiplying each component of the equation of motion by the variation of volume and RR: [Formula: see text]where ∆V is the tidal volume, ELrs is the elastance of the respiratory system, I:E is the inspiratory-to-expiratory time ratio, and R aw is the airway resistance. In 30 patients with normal lungs and in 50 ARDS patients, mechanical power was computed via the power equation and measured from the dynamic pressure-volume curve at 5 and 15 cmH2O PEEP and 6, 8, 10, and 12 ml/kg TV. We then computed the effects of the individual component variables on the mechanical power.

RESULTS

Computed and measured mechanical powers were similar at 5 and 15 cmH2O PEEP both in normal subjects and in ARDS patients (slopes = 0.96, 1.06, 1.01, 1.12 respectively, R (2) > 0.96 and p < 0.0001 for all). The mechanical power increases exponentially with TV, ∆P aw, and flow (exponent = 2) as well as with RR (exponent = 1.4) and linearly with PEEP.

CONCLUSIONS

The mechanical power equation may help estimate the contribution of the different ventilator-related causes of lung injury and of their variations. The equation can be easily implemented in every ventilator's software.

Ventilatory Variables and Mechanical Power in Patients with Acute Respiratory Distress Syndrome.

Costa ELV, Slutsky AS, Brochard LJ, et al. Ventilatory Variables and Mechanical Power in Patients with Acute Respiratory Distress Syndrome. Am J Respir Crit Care Med. 2021;204(3):303‑311. doi:10.1164/rccm.202009‑3467OC

Rationale: Mortality in acute respiratory distress syndrome (ARDS) has decreased after the adoption of lung‑protective strategies. Lower Vt, lower driving pressure (ΔP), lower respiratory rates (RR), and higher end‑expiratory pressure have all been suggested as key components of lung protection strategies. A unifying theoretical explanation has been proposed that attributes lung injury to the energy transfer rate (mechanical power) from the ventilator to the patient, calculated from a combination of several ventilator variables.Objectives: To assess the impact of mechanical power on mortality in patients with ARDS as compared with that of primary ventilator variables such as the ΔP, Vt, and RR.Methods: We obtained data on ventilatory variables and mechanical power from a pooled database of patients with ARDS who had participated in six randomized clinical trials of protective mechanical ventilation and one large observational cohort of patients with ARDS. The primary outcome was mortality at 28 days or 60 days.Measurements and Main Results: We included 4,549 patients (38% women; mean age, 55 ± 23 yr). The average mechanical power was 0.32 ± 0.14 J · min‑1 · kg‑1 of predicted body weight, the ΔP was 15.0 ± 5.8 cm H2O, and the RR was 25.7 ± 7.4 breaths/min. The driving pressure, RR, and mechanical power were significant predictors of mortality in adjusted analyses. The impact of the ΔP on mortality was four times as large as that of the RR.Conclusions: Mechanical power was associated with mortality during controlled mechanical ventilation in ARDS, but a simpler model using only the ΔP and RR was equivalent.

Calculation of mechanical power for pressure‑controlled ventilation.

Becher T, van der Staay M, Schädler D, Frerichs I, Weiler N. Calculation of mechanical power for pressure‑controlled ventilation. Intensive Care Med. 2019;45(9):1321‑1323. doi:10.1007/s00134‑019‑05636‑8

Mechanical power and driving pressure as predictors of mortality among patients with ARDS.

Tonna JE, Peltan I, Brown SM, Herrick JS, Keenan HT; University of Utah Mechanical Power Study Group. Mechanical power and driving pressure as predictors of mortality among patients with ARDS. Intensive Care Med. 2020;46(10):1941‑1943. doi:10.1007/s00134‑020‑06130‑2

Effect of mechanical power on intensive care mortality in ARDS patients.

Coppola S, Caccioppola A, Froio S, et al. Effect of mechanical power on intensive care mortality in ARDS patients. Crit Care. 2020;24(1):246. Published 2020 May 24. doi:10.1186/s13054‑020‑02963‑x


BACKGROUND

In ARDS patients, mechanical ventilation should minimize ventilator‑induced lung injury. The mechanical power which is the energy per unit time released to the respiratory system according to the applied tidal volume, PEEP, respiratory rate, and flow should reflect the ventilator‑induced lung injury. However, similar levels of mechanical power applied in different lung sizes could be associated to different effects. The aim of this study was to assess the role both of the mechanical power and of the transpulmonary mechanical power, normalized to predicted body weight, respiratory system compliance, lung volume, and amount of aerated tissue on intensive care mortality.

METHODS

Retrospective analysis of ARDS patients previously enrolled in seven published studies. All patients were sedated, paralyzed, and mechanically ventilated. After 20 min from a recruitment maneuver, partitioned respiratory mechanics measurements and blood gas analyses were performed with a PEEP of 5 cmH2O while the remaining setting was maintained unchanged from the baseline. A whole lung CT scan at 5 cmH2O of PEEP was performed to estimate the lung gas volume and the amount of well-inflated tissue. Univariate and multivariable Poisson regression models with robust standard error were used to calculate risk ratios and 95% confidence intervals of ICU mortality.

RESULTS

Two hundred twenty-two ARDS patients were included; 88 (40%) died in ICU. Mechanical power was not different between survivors and non-survivors 14.97 [11.51-18.44] vs. 15.46 [12.33-21.45] J/min and did not affect intensive care mortality. The multivariable robust regression models showed that the mechanical power normalized to well-inflated tissue (RR 2.69 [95% CI 1.10-6.56], p = 0.029) and the mechanical power normalized to respiratory system compliance (RR 1.79 [95% CI 1.16-2.76], p = 0.008) were independently associated with intensive care mortality after adjusting for age, SAPS II, and ARDS severity. Also, transpulmonary mechanical power normalized to respiratory system compliance and to well-inflated tissue significantly increased intensive care mortality (RR 1.74 [1.11-2.70], p = 0.015; RR 3.01 [1.15-7.91], p = 0.025).

CONCLUSIONS

In our ARDS population, there is not a causal relationship between the mechanical power itself and mortality, while mechanical power normalized to the compliance or to the amount of well-aerated tissue is independently associated to the intensive care mortality. Further studies are needed to confirm this data.

Mechanical power of ventilation is associated with mortality in critically ill patients: an analysis of patients in two observational cohorts.

Serpa Neto A, Deliberato RO, Johnson AEW, et al. Mechanical power of ventilation is associated with mortality in critically ill patients: an analysis of patients in two observational cohorts. Intensive Care Med. 2018;44(11):1914‑1922. doi:10.1007/s00134‑018‑5375‑6


PURPOSE

Mechanical power (MP) may unify variables known to be related to development of ventilator‑induced lung injury. The aim of this study is to examine the association between MP and mortality in critically ill patients receiving invasive ventilation for at least 48 h.

METHODS

This is an analysis of data stored in the databases of the MIMIC-III and eICU. Critically ill patients receiving invasive ventilation for at least 48 h were included. The exposure of interest was MP. The primary outcome was in-hospital mortality.

RESULTS

Data from 8207 patients were analyzed. Median MP during the second 24 h was 21.4 (16.2-28.1) J/min in MIMIC-III and 16.0 (11.7-22.1) J/min in eICU. MP was independently associated with in-hospital mortality [odds ratio per 5 J/min increase (OR) 1.06 (95% confidence interval (CI) 1.01-1.11); p = 0.021 in MIMIC-III, and 1.10 (1.02-1.18); p = 0.010 in eICU]. MP was also associated with ICU mortality, 30-day mortality, and with ventilator-free days, ICU and hospital length of stay. Even at low tidal volume, high MP was associated with in-hospital mortality [OR 1.70 (1.32-2.18); p < 0.001] and other secondary outcomes. Finally, there is a consistent increase in the risk of death with MP higher than 17.0 J/min.

CONCLUSION

High MP of ventilation is independently associated with higher in-hospital mortality and several other outcomes in ICU patients receiving invasive ventilation for at least 48 h.

Ventilatory settings in the initial 72 h and their association with outcome in out‑of‑hospital cardiac arrest patients: a preplanned secondary analysis of the targeted hypothermia versus targeted normothermia after out‑of‑hospital cardiac arrest (TTM2) trial.

Robba C, Badenes R, Battaglini D, et al. Ventilatory settings in the initial 72 h and their association with outcome in out‑of‑hospital cardiac arrest patients: a preplanned secondary analysis of the targeted hypothermia versus targeted normothermia after out‑of‑hospital cardiac arrest (TTM2) trial. Intensive Care Med. 2022;48(8):1024‑1038. doi:10.1007/s00134‑022‑06756‑4


PURPOSE

The optimal ventilatory settings in patients after cardiac arrest and their association with outcome remain unclear. The aim of this study was to describe the ventilatory settings applied in the first 72 h of mechanical ventilation in patients after out‑of‑hospital cardiac arrest and their association with 6‑month outcomes.

METHODS

Preplanned sub-analysis of the Target Temperature Management-2 trial. Clinical outcomes were mortality and functional status (assessed by the Modified Rankin Scale) 6 months after randomization.

RESULTS

A total of 1848 patients were included (mean age 64 [Standard Deviation, SD = 14] years). At 6 months, 950 (51%) patients were alive and 898 (49%) were dead. Median tidal volume (VT) was 7 (Interquartile range, IQR = 6.2-8.5) mL per Predicted Body Weight (PBW), positive end expiratory pressure (PEEP) was 7 (IQR = 5-9) cmH20, plateau pressure was 20 cmH20 (IQR = 17-23), driving pressure was 12 cmH20 (IQR = 10-15), mechanical power 16.2 J/min (IQR = 12.1-21.8), ventilatory ratio was 1.27 (IQR = 1.04-1.6), and respiratory rate was 17 breaths/minute (IQR = 14-20). Median partial pressure of oxygen was 87 mmHg (IQR = 75-105), and partial pressure of carbon dioxide was 40.5 mmHg (IQR = 36-45.7). Respiratory rate, driving pressure, and mechanical power were independently associated with 6-month mortality (omnibus p-values for their non-linear trajectories: p < 0.0001, p = 0.026, and p = 0.029, respectively). Respiratory rate and driving pressure were also independently associated with poor neurological outcome (odds ratio, OR = 1.035, 95% confidence interval, CI = 1.003-1.068, p = 0.030, and OR = 1.005, 95% CI = 1.001-1.036, p = 0.048). A composite formula calculated as [(4*driving pressure) + respiratory rate] was independently associated with mortality and poor neurological outcome.

CONCLUSIONS

Protective ventilation strategies are commonly applied in patients after cardiac arrest. Ventilator settings in the first 72 h after hospital admission, in particular driving pressure and respiratory rate, may influence 6-month outcomes.

Effect of mechanical power on mortality in invasively ventilated ICU patients without the acute respiratory distress syndrome: An analysis of three randomised clinical trials.

van Meenen DMP, Algera AG, Schuijt MTU, et al. Effect of mechanical power on mortality in invasively ventilated ICU patients without the acute respiratory distress syndrome: An analysis of three randomised clinical trials. Eur J Anaesthesiol. 2023;40(1):21‑28. doi:10.1097/EJA.0000000000001778


BACKGROUND

The mechanical power of ventilation (MP) has an association with outcome in invasively ventilated patients with the acute respiratory distress syndrome (ARDS). Whether a similar association exists in invasively ventilated patients without ARDS is less certain.

OBJECTIVE

To investigate the association of mechanical power with mortality in ICU patients without ARDS.

DESIGN

This was an individual patient data analysis that uses the data of three multicentre randomised trials.

SETTING

This study was performed in academic and nonacademic ICUs in the Netherlands.

PATIENTS

One thousand nine hundred and sixty‑two invasively ventilated patients without ARDS were included in this analysis. The median [IQR] age was 67 [57 to 75] years, 706 (36%) were women.

MAIN OUTCOME MEASURES

The primary outcome was the all-cause mortality at day 28. Secondary outcomes were the all-cause mortality at day 90, and length of stay in ICU and hospital.

RESULTS

At day 28, 644 patients (33%) had died. Hazard ratios for mortality at day 28 were higher with an increasing MP, even when stratified for its individual components (driving pressure ( P  < 0.001), tidal volume ( P  < 0.001), respiratory rate ( P  < 0.001) and maximum airway pressure ( P  = 0.001). Similar associations of mechanical power (MP) were found with mortality at day 90, lengths of stay in ICU and hospital. Hazard ratios for mortality at day 28 were not significantly different if patients were stratified for MP, with increasing levels of each individual component.

CONCLUSION

In ICU patients receiving invasive ventilation for reasons other than ARDS, MP had an independent association with mortality. This finding suggests that MP holds an added predictive value over its individual components, making MP an attractive measure to monitor and possibly target in these patients.

TRIAL REGISTRATION

ClinicalTrials.gov Identifier: NCT02159196, ClinicalTrials.gov Identifier: NCT02153294, ClinicalTrials.gov Identifier: NCT03167580.

Which component of mechanical power is most important in causing VILI?

Marini JJ, Rocco PRM. Which component of mechanical power is most important in causing VILI?. Crit Care. 2020;24(1):39. Published 2020 Feb 5. doi:10.1186/s13054‑020‑2747‑4

Intra‑cycle power: is the flow profile a neglected component of lung protection?

Marini JJ, Crooke PS, Gattinoni L. Intra‑cycle power: is the flow profile a neglected component of lung protection?. Intensive Care Med. 2021;47(5):609‑611. doi:10.1007/s00134‑021‑06375‑5

Driving pressure and survival in the acute respiratory distress syndrome.

Amato MB, Meade MO, Slutsky AS, et al. Driving pressure and survival in the acute respiratory distress syndrome. N Engl J Med. 2015;372(8):747‑755. doi:10.1056/NEJMsa1410639


BACKGROUND

Mechanical‑ventilation strategies that use lower end‑inspiratory (plateau) airway pressures, lower tidal volumes (VT), and higher positive end‑expiratory pressures (PEEPs) can improve survival in patients with the acute respiratory distress syndrome (ARDS), but the relative importance of each of these components is uncertain. Because respiratory‑system compliance (CRS) is strongly related to the volume of aerated remaining functional lung during disease (termed functional lung size), we hypothesized that driving pressure (ΔP=VT/CRS), in which VT is intrinsically normalized to functional lung size (instead of predicted lung size in healthy persons), would be an index more strongly associated with survival than VT or PEEP in patients who are not actively breathing.

METHODS

Using a statistical tool known as multilevel mediation analysis to analyze individual data from 3562 patients with ARDS enrolled in nine previously reported randomized trials, we examined ΔP as an independent variable associated with survival. In the mediation analysis, we estimated the isolated effects of changes in ΔP resulting from randomized ventilator settings while minimizing confounding due to the baseline severity of lung disease.

RESULTS

Among ventilation variables, ΔP was most strongly associated with survival. A 1-SD increment in ΔP (approximately 7 cm of water) was associated with increased mortality (relative risk, 1.41; 95% confidence interval [CI], 1.31 to 1.51; P<0.001), even in patients receiving "protective" plateau pressures and VT (relative risk, 1.36; 95% CI, 1.17 to 1.58; P<0.001). Individual changes in VT or PEEP after randomization were not independently associated with survival; they were associated only if they were among the changes that led to reductions in ΔP (mediation effects of ΔP, P=0.004 and P=0.001, respectively).

CONCLUSIONS

We found that ΔP was the ventilation variable that best stratified risk. Decreases in ΔP owing to changes in ventilator settings were strongly associated with increased survival. (Funded by Fundação de Amparo e Pesquisa do Estado de São Paulo and others.).