Мы обнаружили, что вы посещаете наш сайт из страны Соединенные Штаты.
Для вашей страны (Соединенные Штаты) доступна отдельная версия веб-сайта.

 Технологии

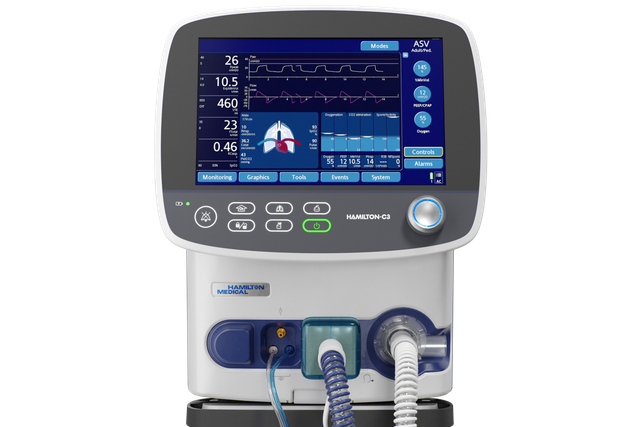
Система мониторинга Ventilation Cockpit. Сложная информация простыми словами

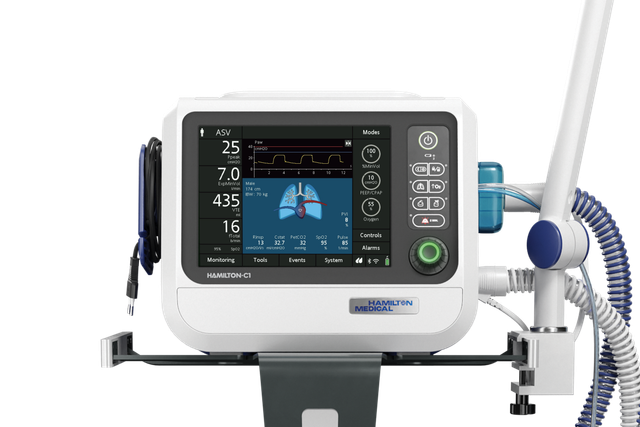
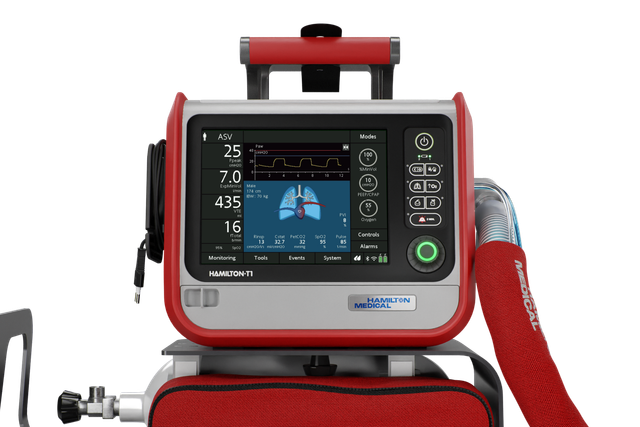
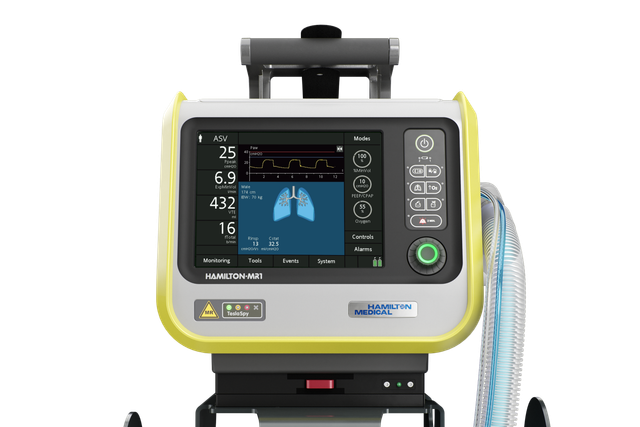
Серия аппаратов ИВЛ Hamilton

Наша концепция. Единый интерфейс для управления всеми устройствами

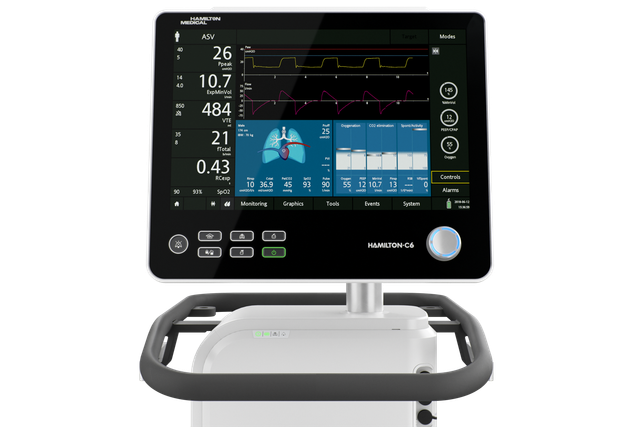
Все аппараты ИВЛ Hamilton Medical, которые используются в отделении интенсивной терапии, кабинете МРТ или при транспортировке, имеют одинаковый интерфейс пользователя.

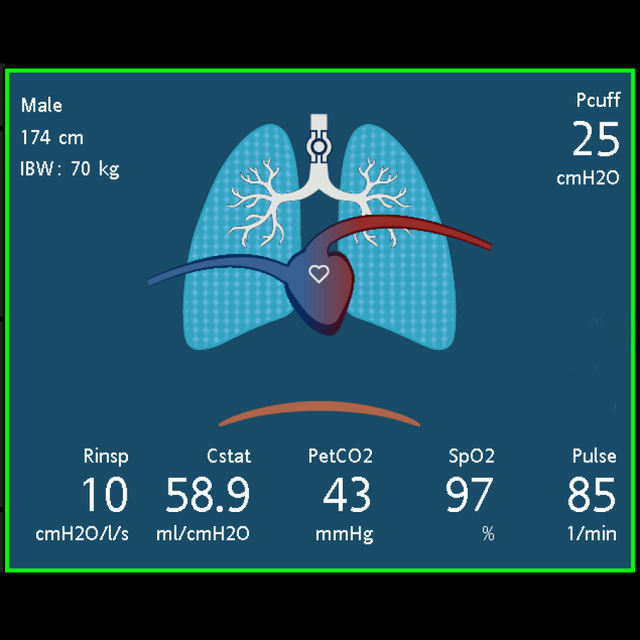
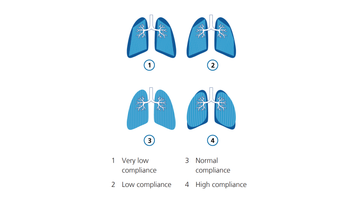
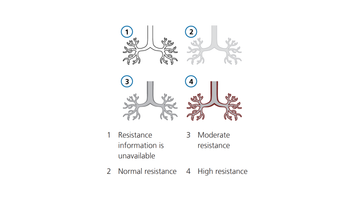
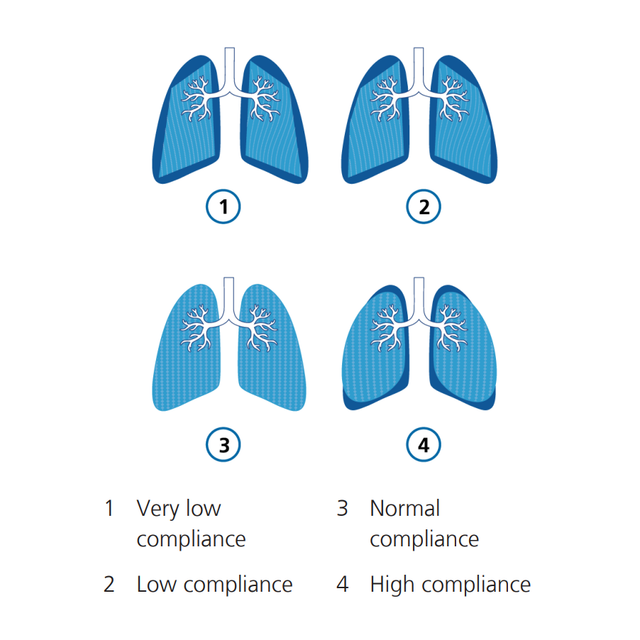
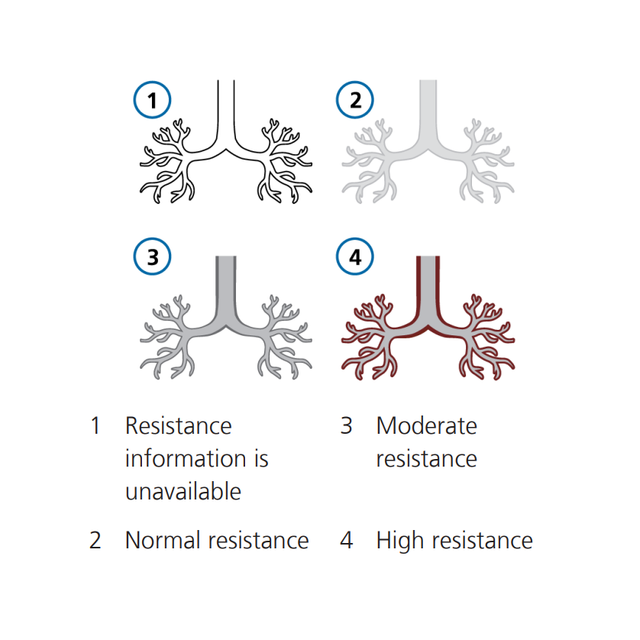
В системе Ventilation Cockpit сложные данные отображаются в виде интуитивно понятных графиков.

Вдох. Графическое представление сложных данных

Исследование показало, что одного лишь отображения числовых показателей и кривых недостаточно для предоставления врачам информации на оптимальном уровне  (Drews FA, Westenskow DR. The right picture is worth a thousand numbers: data displays in anesthesia. Hum Factors. 2006;48(1):59-71. doi:10.1518/0018720067764122701​). Более приемлемой альтернативой оказалось графическое представление, при котором интегрированные данные визуализируются, что помогает врачам выявлять и лечить побочные респираторные проблемы быстрее (Wachter SB, Johnson K, Albert R, Syroid N, Drews F, Westenskow D. The evaluation of a pulmonary display to detect adverse respiratory events using high resolution human simulator. J Am Med Inform Assoc. 2006;13(6):635-642. doi:10.1197/jamia.M21232​).

При создании панели системы мониторинга Ventilation Cockpit мы брали за основу кабины самолетов, в которых интегрированные сложные данные визуализируются простым способом.
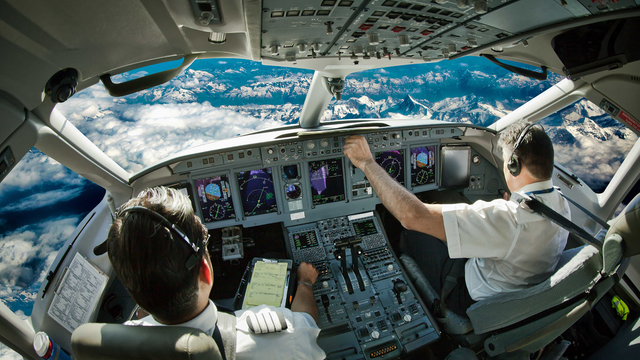
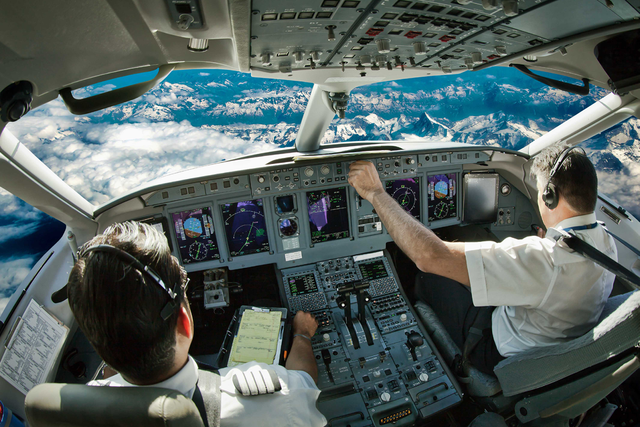
Кабина самолета, где работают пилоты. Кабина самолета, где работают пилоты.
Панель «Состояние вентиляции»

Готовы отлучить пациента? Панель «Состояние вентиляции»

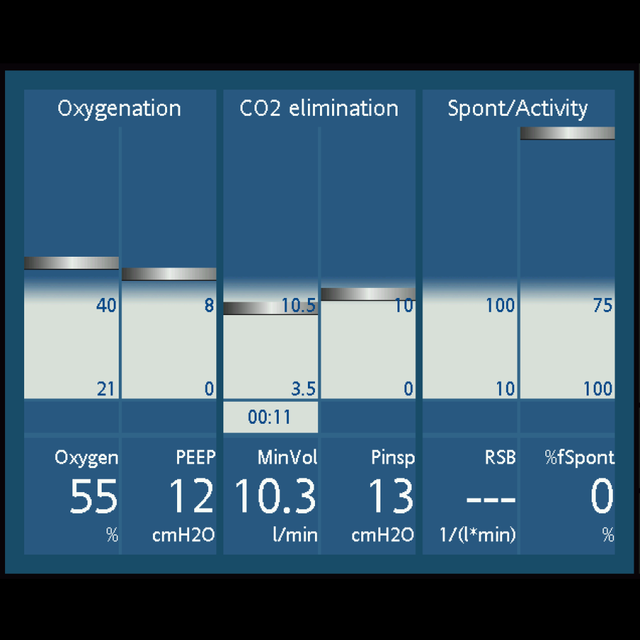
На панели «Состояние вентиляции» отображаются шесть параметров, которые связаны с зависимостью пациента от аппарата ИВЛ, в т. ч. оксигенация, выведение CO2 и дыхательная активность пациента.

Плавающий в пределах столбца индикатор отображает значение определенного параметра. Когда индикатор находится в серой зоне (отлучение), запускается таймер, который показывает, как долго это значение находится в зоне отлучения.

Панель окаймлена рамкой зеленого цвета, если в зоне отлучения находятся все значения. Это означает, что можно начинать тесты спонтанного дыхания.

Крейг Джолли

Отзывы клиентов

Как показывает опыт, панель «Динамическое легкое» очень полезна: не все могут легко разобраться в цифрах. Это особенно касается начинающих терапевтов. Но иллюстрации всегда просты и наглядны.

Крейг Джолли

координатор образования в сфере лечения
медицинский центр Лаббокского университета, штат Техас, США

Доступность

Система мониторинга Ventilation Cockpit – это стандартная функция всех наших аппаратов ИВЛ для интенсивной терапии.

Список литературы

  1. 1. Drews FA, Westenskow DR. The right picture is worth a thousand numbers: data displays in anesthesia. Hum Factors. 2006;48(1):59-71. doi:10.1518/001872006776412270


  1. 2. Wachter SB, Johnson K, Albert R, Syroid N, Drews F, Westenskow D. The evaluation of a pulmonary display to detect adverse respiratory events using high resolution human simulator. J Am Med Inform Assoc. 2006;13(6):635-642. doi:10.1197/jamia.M2123

Сноски

  • A. Доступно как встроенное устройство для аппаратов ИВЛ HAMILTON‑C6/G5/S1 и как автономное устройство для аппарата ИВЛ HAMILTON-C3


  • B. Параметр недоступен на аппаратах ИВЛ HAMILTON-MR1

The right picture is worth a thousand numbers: data displays in anesthesia.

Drews FA, Westenskow DR. The right picture is worth a thousand numbers: data displays in anesthesia. Hum Factors. 2006;48(1):59-71. doi:10.1518/001872006776412270


OBJECTIVE

To review the literature on data displays in anesthesia identifying issues and developing design recommendations.

BACKGROUND

Unexpected incidents are common in critical care medicine. Adverse outcomes are frequently the catastrophic endpoints of an "evolving" chain of subtle incidents. One strategy to reduce the likelihood of an adverse patient outcome during anesthesia is to improve the anesthesiologist's ability to detect, diagnose, and treat critical incidents.

METHOD

A literature review and analysis of data displays.

RESULTS

Current numerical and waveform displays do not support anesthesiologists optimally. An alternative is graphical displays that functionally integrate variables into objects. In a well-designed graphic object, deviations from normal are shown by distortions in the object's symmetry. The emerging patterns that result from distorted symmetry facilitate the correct diagnosis. When treatment is effective, an object's shape is restored to normal. Graphical displays can be an effective tool in supporting anesthesiologists' situation awareness.

CONCLUSION

Problems related to graphical displays have delayed their use in anesthesia, including the lack of conclusive clinical evidence of their value. However, currently more evidence is accumulating that graphical displays have the potential to improve clinical performance. The successful development of these graphical displays takes into account task requirements, a user's perceptual processes, and task-specific cognition.

APPLICATION

This paper provides suggestions for the development of more effective displays in anesthesiology. Graphical displays can increase the anesthesiologist's situation awareness and improve clinical performance. Clinical use of these displays has the potential to significantly improve patient safety.

The evaluation of a pulmonary display to detect adverse respiratory events using high resolution human simulator.

Wachter SB, Johnson K, Albert R, Syroid N, Drews F, Westenskow D. The evaluation of a pulmonary display to detect adverse respiratory events using high resolution human simulator. J Am Med Inform Assoc. 2006;13(6):635-642. doi:10.1197/jamia.M2123


OBJECTIVE

Authors developed a picture-graphics display for pulmonary function to present typical respiratory data used in perioperative and intensive care environments. The display utilizes color, shape and emergent alerting to highlight abnormal pulmonary physiology. The display serves as an adjunct to traditional operating room displays and monitors.

DESIGN

To evaluate the prototype, nineteen clinician volunteers each managed four adverse respiratory events and one normal event using a high-resolution patient simulator which included the new displays (intervention subjects) and traditional displays (control subjects). Between-group comparisons included (i) time to diagnosis and treatment for each adverse respiratory event; (ii) the number of unnecessary treatments during the normal scenario; and (iii) self-reported workload estimates while managing study events.

MEASUREMENTS

Two expert anesthesiologists reviewed video-taped transcriptions of the volunteers to determine time to treat and time to diagnosis. Time values were then compared between groups using a Mann-Whitney-U Test. Estimated workload for both groups was assessed using the NASA-TLX and compared between groups using an ANOVA. P-values < 0.05 were considered significant.

RESULTS

Clinician volunteers detected and treated obstructed endotracheal tubes and intrinsic PEEP problems faster with graphical rather than conventional displays (p < 0.05). During the normal scenario simulation, 3 clinicians using the graphical display, and 5 clinicians using the conventional display gave unnecessary treatments. Clinician-volunteers reported significantly lower subjective workloads using the graphical display for the obstructed endotracheal tube scenario (p < 0.001) and the intrinsic PEEP scenario (p < 0.03).

CONCLUSION

Authors conclude that the graphical pulmonary display may serve as a useful adjunct to traditional displays in identifying adverse respiratory events.