返回

How to assess recruitability using a pressure-volume curve

文章

作者: Jean-Michel Arnal

日期: 09.04.2024

A proven method for assessing a patient's potential for lung recruitment is the use of pressure-volume curves.

P/V Tool settings

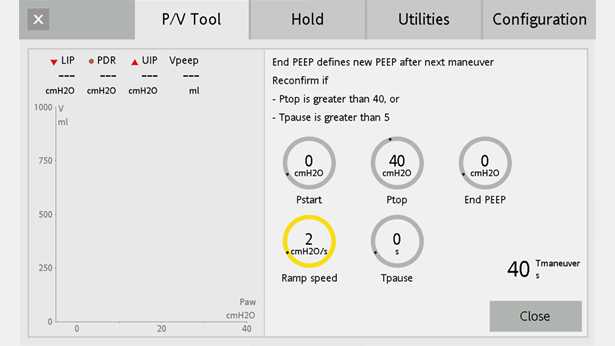
Bedside assessment of recruitability can be used in early-onset ARDS patients who are totally passive with no leaks in the ventilator circuit. In the P/V Tool (Available as an option on HAMILTON-G5 and HAMILTON-C3/C6 ventilatorsA​, Standard on the HAMILTON-S1B​) tab, I start with the following settings (Figure 1):

  • Pstart = 0 cmH2O
  • Ptop = 40 cmH2O
  • End PEEP = 0 cmH2O
  • Ramp speed = 2 cmH2O/s
  • Tpause = 0 s

Note that the same assessment can be performed using the ventilator’s default setting for Pstart and End PEEP, which is 5 cmH2O. 

Screenshot of ventilator display showing P/V Tool settings
Figure 1
Screenshot of ventilator display showing P/V Tool settings
Figure 1

Interpretation

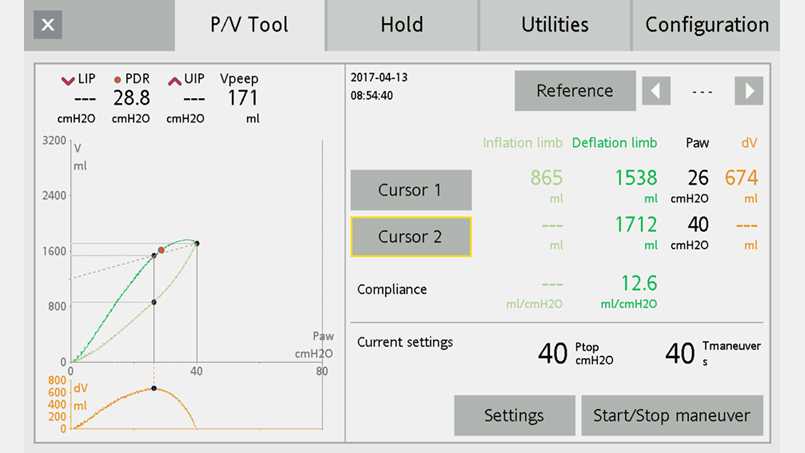
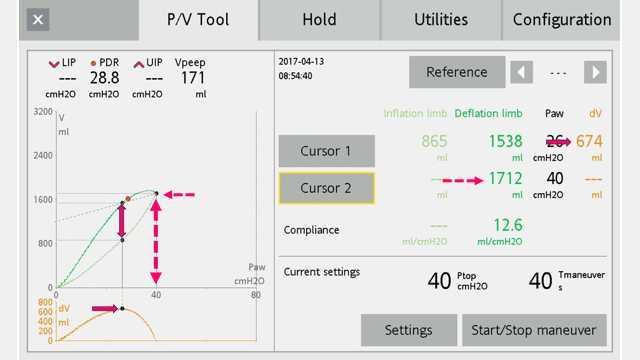
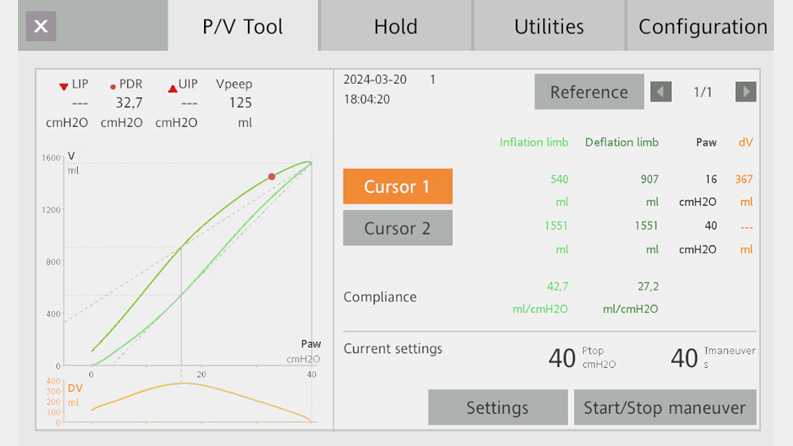
Select the panel that displays the P/V curve together with the automatic calculation of the volume difference for each pressure (Paw/V + Paw/dV graph) (Figures 2 and 3).

  • Position Cursor 1 at the point representing the maximum distance between the inflation and deflation limbs (this equates to the highest point on the dV curve).
  • Position Cursor 2 at the point representing the maximum volume reached during the maneuver (at the highest pressure).  

Now you can calculate the normalized maximum distance (NMD). NMD is expressed as a percentage and equals the maximum distance divided by the maximum volume.

So in this example: NMD = (674/1712) x 100 = 39%

The NMD% value of 41 can be used to distinguish between lungs with high potential for recruitment (NMD% ≥ 41) and lungs with limited potential where recruitment may be more difficult to achieve (NMD% < 41) (
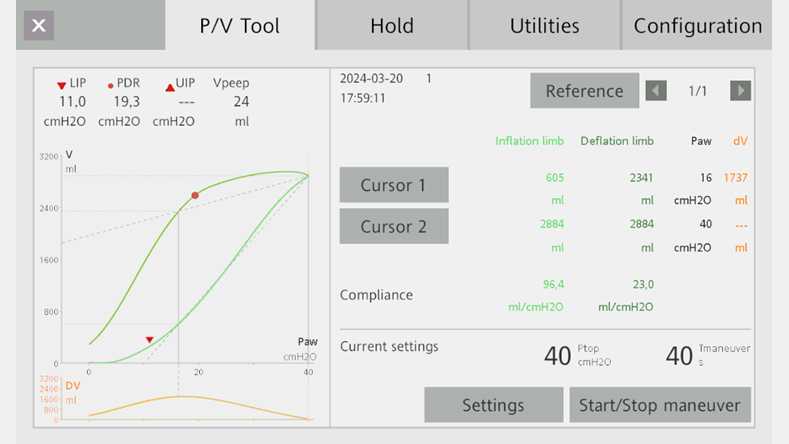
Chiumello D, Arnal JM, Umbrello M, et al. Hysteresis and Lung Recruitment in Acute Respiratory Distress Syndrome Patients: A CT Scan Study [published correction appears in Crit Care Med. 2022 Mar 1;50(3):e339]. Crit Care Med. 2020;48(10):1494-1502. doi:10.1097/CCM.00000000000045181​).

Screenshot showing Paw/V + Paw/dV graph
Figure 2
Screenshot showing Paw/V + Paw/dV graph
Figure 2
Screenshot wiht markings showing maximum volume and delta volume
Figure 3
Screenshot wiht markings showing maximum volume and delta volume
Figure 3

Examples

Figure 4:
Mr. A. is a 72-year-old patient admitted for ARDS.
NMD = (1737/2884) x 100 = 60%
This patient is likely to benefit from a recruitment strategy.

Figure 5:
Mr. L is a 66-year-old patient admitted for ARDS.
NMD = (367/1551) x 100 = 24%
This patient is unlikely to benefit from a recruitment strategy.

Screenshot showing PV loop with max distance of 1737 and max volume of 2884
Figure 4
Screenshot showing PV loop with max distance of 1737 and max volume of 2884
Figure 4
Screenshot showing PV loop with max distance of 367 and max volume of 1551
Figure 5
Screenshot showing PV loop with max distance of 367 and max volume of 1551
Figure 5

Hysteresis and Lung Recruitment in Acute Respiratory Distress Syndrome Patients: A CT Scan Study.

Chiumello D, Arnal JM, Umbrello M, et al. Hysteresis and Lung Recruitment in Acute Respiratory Distress Syndrome Patients: A CT Scan Study [published correction appears in Crit Care Med. 2022 Mar 1;50(3):e339]. Crit Care Med. 2020;48(10):1494-1502. doi:10.1097/CCM.0000000000004518


OBJECTIVES

Hysteresis of the respiratory system pressure-volume curve is related to alveolar surface forces, lung stress relaxation, and tidal reexpansion/collapse. Hysteresis has been suggested as a means of assessing lung recruitment. The objective of this study was to determine the relationship between hysteresis, mechanical characteristics of the respiratory system, and lung recruitment assessed by a CT scan in mechanically ventilated acute respiratory distress syndrome patients.

DESIGN

Prospective observational study.

SETTING

General ICU of a university hospital.

PATIENTS

Twenty-five consecutive sedated and paralyzed patients with acute respiratory distress syndrome (age 64 ± 15 yr, body mass index 26 ± 6 kg/m, PaO2/FIO2 147 ± 42, and positive end-expiratory pressure 9.3 ± 1.4 cm H2O) were enrolled.

INTERVENTIONS

A low-flow inflation and deflation pressure-volume curve (5-45 cm H2O) and a sustained inflation recruitment maneuver (45 cm H2O for 30 s) were performed. A lung CT scan was performed during breath-holding pressure at 5 cm H2O and during the recruitment maneuver at 45 cm H2O.

MEASUREMENTS AND MAIN RESULTS

Lung recruitment was computed as the difference in noninflated tissue and in gas volume measured at 5 and at 45 cm H2O. Hysteresis was calculated as the ratio of the area enclosed by the pressure-volume curve and expressed as the hysteresis ratio. Hysteresis was correlated with respiratory system compliance computed at 5 cm H2O and the lung gas volume entering the lung during inflation of the pressure-volume curve (R = 0.749, p < 0.001 and R = 0.851, p < 0.001). The hysteresis ratio was related to both lung tissue and gas recruitment (R = 0.266, p = 0.008, R = 0.357, p = 0.002, respectively). Receiver operating characteristic analysis showed that the optimal cutoff value to predict lung tissue recruitment for the hysteresis ratio was 28% (area under the receiver operating characteristic curve, 0.80; 95% CI, 0.62-0.98), with sensitivity and specificity of 0.75 and 0.77, respectively.

CONCLUSIONS

Hysteresis of the respiratory system computed by low-flow pressure-volume curve is related to the anatomical lung characteristics and has an acceptable accuracy to predict lung recruitment.