Author: Karjaghli Munir, Respiratory Therapist, Hamilton Medical Clinical Application Specialist; Matthias Himmelstoss, ICU Nurse, MSc Physics, Product Manager
Date of first publication: 16.11.2023
Anatomical dead space, alveolar dead space, and CO2 elimination: Learn how they can give you an insight into the patient's lung condition.

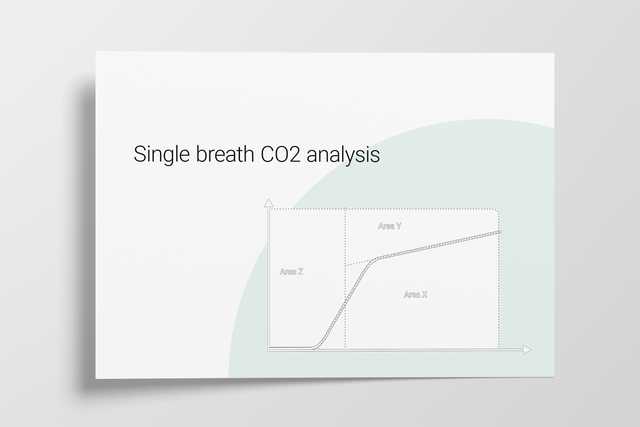
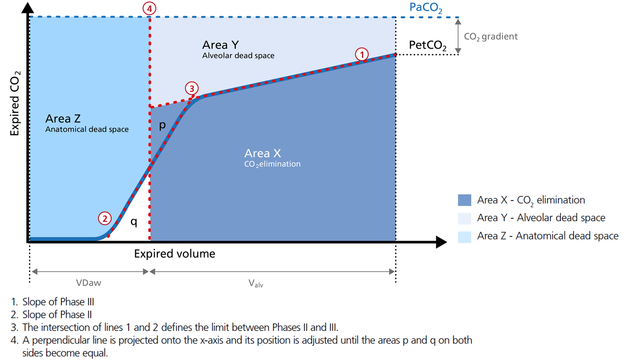
The volumetric capnogram can also be divided into three areas:
The size of the areas, as well as the form of the curve, can give you more insight into the patient‘s lung condition regarding:
In the illustration (Figure 1) you can see:
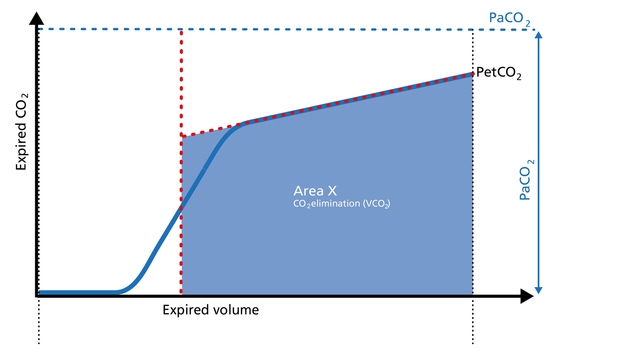
Area X represents the actual volume of CO2 exhaled in one breath (VeCO2). Adding up all of the single breaths in one minute gives you the total elimination of CO2 per minute (V‘CO2). If cardiac output, lung perfusion, and ventilation are stable, this is an assessment of the production of CO2 called V‘CO2. The V‘CO2 value displayed on the ventilator can be affected by any change in CO2 production, cardiac output, lung perfusion, and ventilation. It indicates instantly how the patient’s gas exchange responds to a change in ventilator settings. Monitoring trends allows for detection of sudden and rapid changes in V‘CO2 (Figure 2).
Good to know:
Decreasing V‘CO2: Hypothermia, deep sedation, hypothyroidism, paralysis, and brain death decrease CO2 production and induce a decrease in V‘CO2. Decreasing V‘CO2 can also be due to a decrease in cardiac output or blood loss, and may also suggest a change in blood flow to the lung areas. Pulmonary embolism, for example, exhibits V‘CO2 reduction and a slope reduction in Phase II.
Increase in V‘CO2: An increase in V'CO2 is usually due to bicarbonate infusion or an increase in CO2 production that can be caused by:
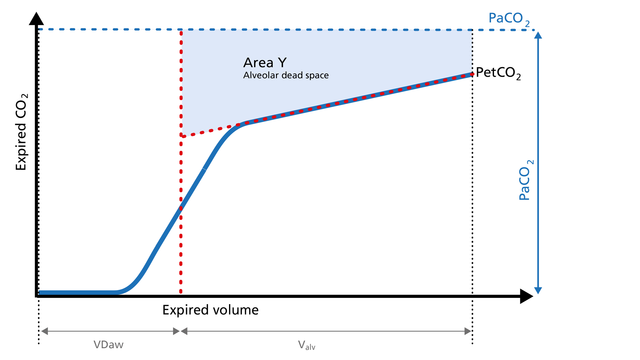
Area Y represents the amount of CO2 that is not eliminated due to alveolar dead space (Figure 3).
Good to know:
Increase: Alveolar dead space is increased in cases of lung emphysema, lung overdistension, pulmonary embolism, pulmonary hypertension, and cardiac output compromise.
Decrease: If the above mentioned conditions improve due to successful therapy, the alveolar
dead space decreases.
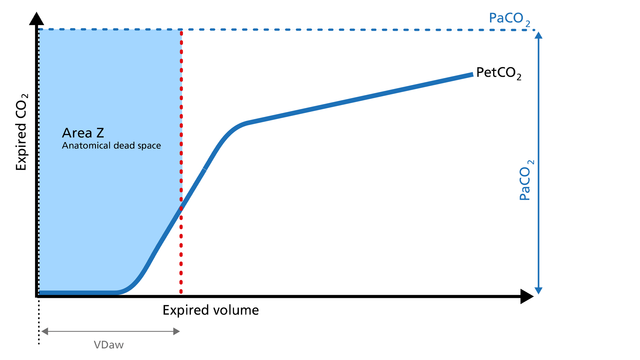
Anatomical dead space measurement using a volumetric capnogram gives an effective, in-vivo measure of volume lost in the conducting airway. This area represents a volume without CO2. It does not take part in the gas exchange and consists of the airway, endotracheal tube, and artificial accessories, such as a flextube positioned between the CO2 sensor and the patient (Figure 4).
Good to know:
Expansion of Area Z: An expansion of Area Z can indicate an increase in anatomical dead space ventilation (VDaw). Consider a reduction in your artificial dead space volume.
Diminution of Area Z: A diminution of Area Z is seen when the artificial dead space volume is decreased and when excessive PEEP is decreased.
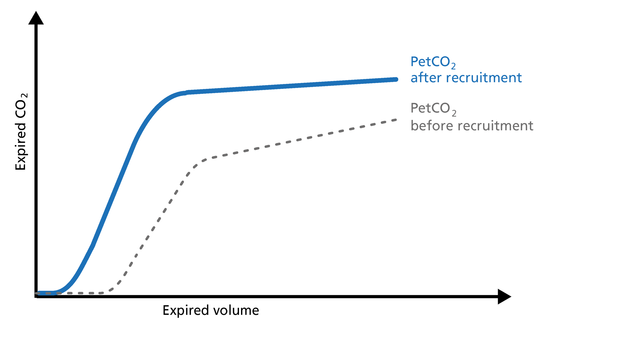
Phase III of the waveform represents the quantity of gas that comes from the alveoli and actively participates in gas exchange. V‘alv is calculated by subtracting the anatomical dead space (VDaw) from the tidal volume (VTE) multiplied by the respiratory rate from the minute volume (MinVol): V’alv =RR*Vtalv = RR*(VTE-VDaw) (Figure 5).
Good to know:
Increase: An increase in V‘alv is seen after an efficient recruitment maneuver and induces a transient increase in V‘CO2.
Decrease: A decrease in V‘alv can indicate that fewer alveoli are participating in the gas exchange, for example, due to pulmonary edema.
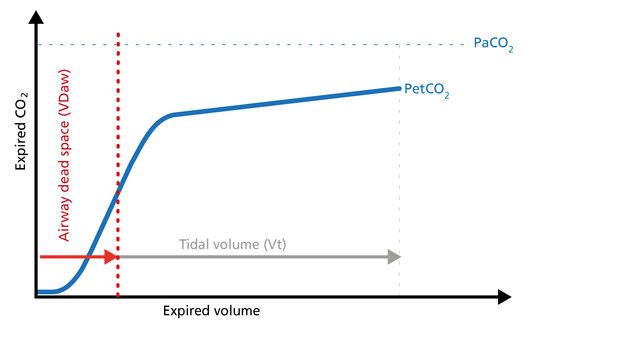
The ratio of airway dead space (VDaw) to tidal volume (VTE) – the VDaw/VTE ratio – gives you an insight into the effectiveness of ventilation (Figure 6).
Good to know: A rising VDaw/VTE ratio can be a sign of ARDS.
All Hamilton Medical ventilators offer volumetric capnography (
Full citations below: (
Learn how to interpret a volumetric capnogram and get an overview of the benefits and clinical applications of volumetric capnography. Includes a self-test!
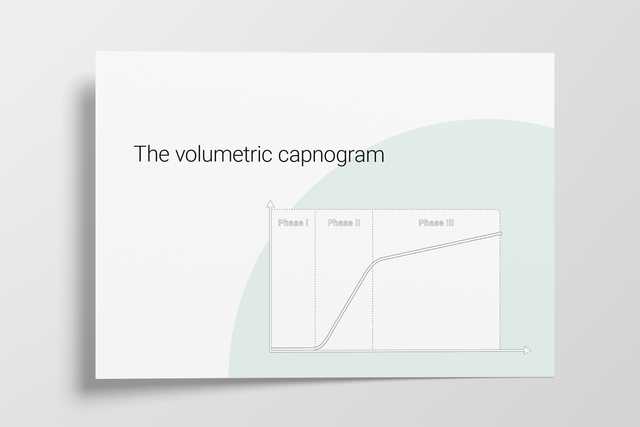
A single breath curve in volumetric capnography exhibits three characteristic phases of changing gas mixtures. Learn more about anatomical dead space, the transition phase, and the plateau phase.

The CO2 curve can give an insight into multiple clinical scenarios, including ARDS, pulmonary embolism, and obstructive lung disease. It can also help manage the PEEP setting. Explore the clinical relevance.

Rising and falling trends for PetCO2 and V’CO2 help identify potential changes in the patient’s condition. Learn about the clinical application of trends.