Author: Karjaghli Munir, Respiratory Therapist, Hamilton Medical Clinical Application Specialist; Matthias Himmelstoss, ICU Nurse, MSc Physics, Product Manager
Date of first publication: 16.11.2023
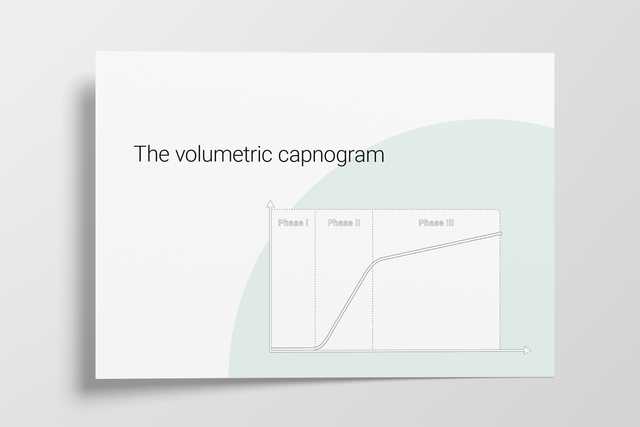
A single breath curve in volumetric capnography exhibits three characteristic phases of changing gas mixtures. Learn more about anatomical dead space, the transition phase, and the plateau phase.

Carbon dioxide (CO2) is the most abundant gas produced by the human body. CO2 is the primary drive to breathe and a primary motivation for mechanically ventilating a patient. Monitoring the CO2 level during respiration (capnography) is noninvasive, easy to do, relatively inexpensive, and has been studied extensively.
Capnography has improved over the last few decades thanks to the development of faster infrared sensors that can measure CO2 at the airway opening in real time. By knowing how CO2 behaves on its way from the bloodstream through the alveoli to the ambient air, physicians can obtain useful information about ventilation and perfusion.
There are two distinct types of capnography: Conventional, time-based capnography allows only qualitative and semi-quantitative, and sometimes misleading, measurements, so volumetric capnography has emerged as the preferred method to assess the quality and quantity of ventilation.
In short, volumetric capnography is a valuable tool to improve the ventilation quality and efficiency for your ventilated patients.
The alveolar concentration of carbon dioxide (CO2) is the result of metabolism, cardiac output, lung perfusion, and ventilation. Change in the concentration of CO2 reflects perturbations in any or a combination of these factors. Volumetric capnography provides continuous monitoring of CO2 production, ventilation/perfusion (V/Q) status, and airway patency, as well as function of the ventilator breathing circuit itself.
Expired gas receives CO2 from three sequential compartments of the airways, forming three recognizable phases on the expired capnogram. A single-breath curve in volumetric capnography exhibits these three characteristic phases of changing gas mixtures - they refer to the airway region in which they originate:
Using features from each phase, physiologic measurements can be calculated.
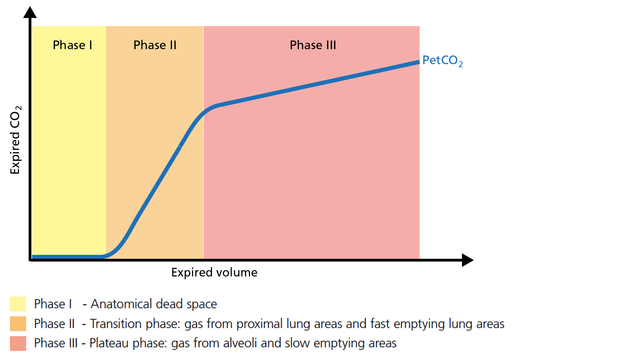
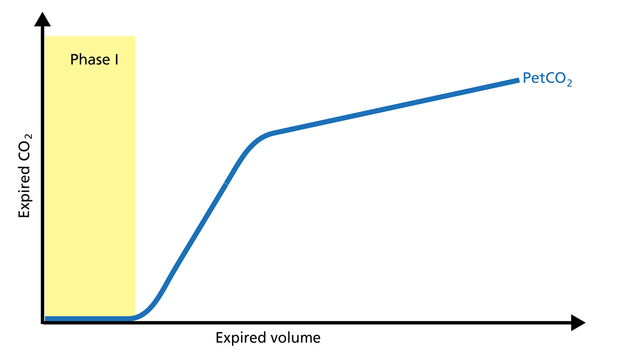
The first gas that passes the sensor at the onset of expiration comes from the airways and the breathing circuit where no gas exchange has taken place = anatomical + artificial dead space. This gas usually does not contain any CO2. Hence the graph shows movement along the X-axis (expired volume), but no gain in CO2 on the Y-axis (Figure 2).
Good to know: A prolonged Phase I indicates an increase in anatomical dead space ventilation (VDaw). Presence of CO2 during Phase I indicates rebreathing or that the sensor needs to be recalibrated.
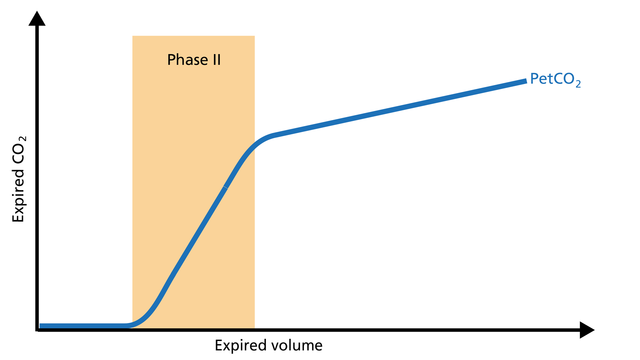
Phase II represents gas that is composed partially of distal airway volume and mixed with gas from fast- emptying alveoli. The curve slope represents transition velocity between distal airway and alveolar gas – providing information about perfusion changes and also about airway resistances (Figure 3).
Good to know: A prolonged Phase II can indicate an increase in airway resistance and/or a Ventilation/Perfusion (V/P) mismatch.
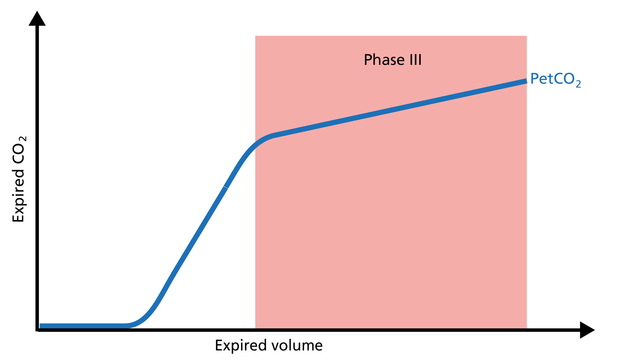
Phase III gas is entirely from the alveoli where the gas exchange takes place. This phase is representative of gas distribution. The final CO2 value in Phase III is called end-tidal CO2 (PetCO2) (Figure 4).
Good to know: A steep slope in Phase III provides information about lung heterogeneity with some fast- and some slow-emptying lung areas. For example, an obstructed airway results in insufficiently ventilated alveoli, inducing high CO2 values and increased time constants in this region.
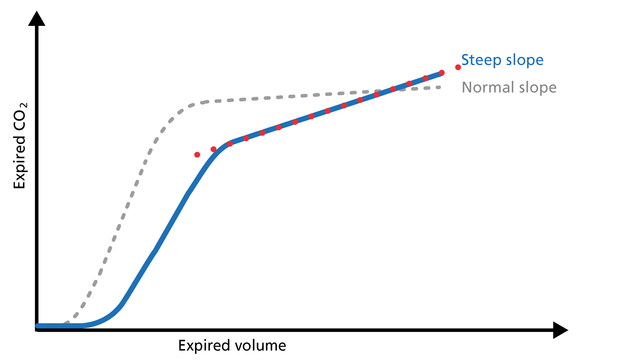
The slope of Phase III is a characteristic of the volumetric capnogram shape. This slope is measured in the geometric center of the curve, which is defined as the middle two quarters lying between VDaw and the end of exhalation (Figure 5).
Good to know: In Phase III, a steep slope can be seen, for example, in COPD and ARDS patients.
All Hamilton Medical ventilators offer volumetric capnography (
Full citations below: (
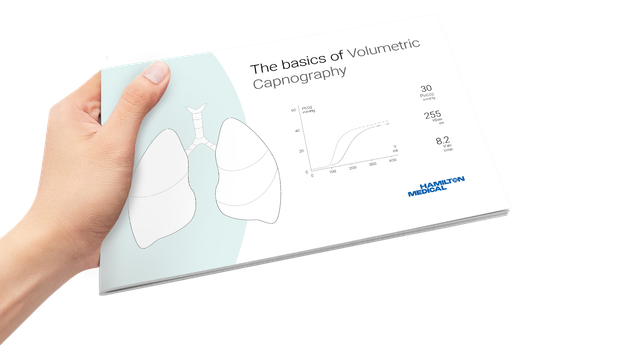
Learn how to interpret a volumetric capnogram and get an overview of the benefits and clinical applications of volumetric capnography. Includes a self-test!
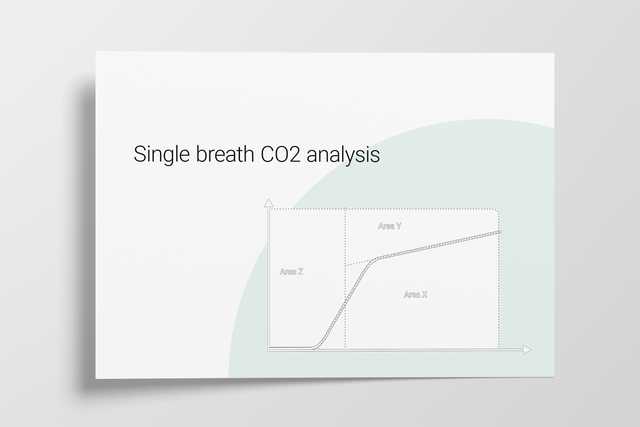
Anatomical dead space, alveolar dead space, and CO2 elimination: Learn how they can give you an insight into the patient's lung condition.

The CO2 curve can give an insight into multiple clinical scenarios, including ARDS, pulmonary embolism, and obstructive lung disease. It can also help manage the PEEP setting. Explore the clinical relevance.

Rising and falling trends for PetCO2 and V’CO2 help identify potential changes in the patient’s condition. Learn about the clinical application of trends.