
Author: Karjaghli Munir, Respiratory Therapist, Hamilton Medical Clinical Application Specialist; Matthias Himmelstoss, ICU Nurse, MSc Physics, Product Manager
Date of first publication: 16.11.2023
The CO2 curve can give an insight into multiple clinical scenarios, including ARDS, pulmonary embolism, and obstructive lung disease. It can also help manage the PEEP setting. Explore the clinical relevance.

You can use the insights from the CO2 curve to improve ventilation quality and efficiency for your patients. Below you will find examples of use of the CO2 curve for the following clinical scenarios:
In ARDS, the ventilation/perfusion ratio is disturbed and changes in the slope of the volumetric capnogram curve can be observed (Figure 1).
Good to know: Phase I is larger due to increased anatomical dead space caused by PEEP. The slope of Phase II is decreased due to lung perfusion abnormalities. The slope of Phase III is increased due to lung heterogeneity.

If PEEP is too high, the intrathoracic pressure rises, the venous return decreases, and pulmonal vascular resistance (PVR) increases. These changes can easily be observed on the volumetric capnogram (Figure 2). The clinician can use volumetric capnography to check and manage the PEEP setting.
Good to know:
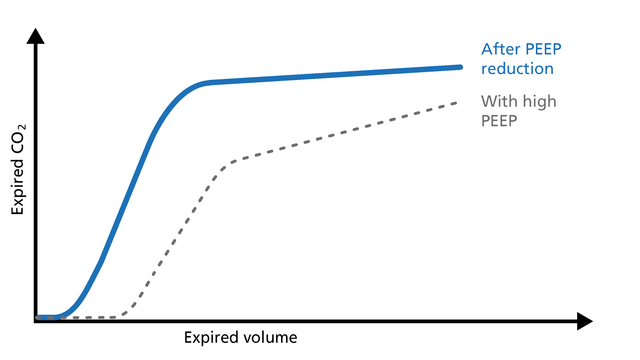
The volumetric capnogram can be used to assess the effectiveness of recruitment maneuvers and might give you an insight into the recruited lung volume (Figure 3).
Good to know: After a successful recruitment maneuver, you should see a transient increase in V‘CO2. Phase I may decrease a little. The slope of Phase II becomes steeper with improved lung perfusion. The slope of Phase III improves as a result of more homogeneous lung emptying.

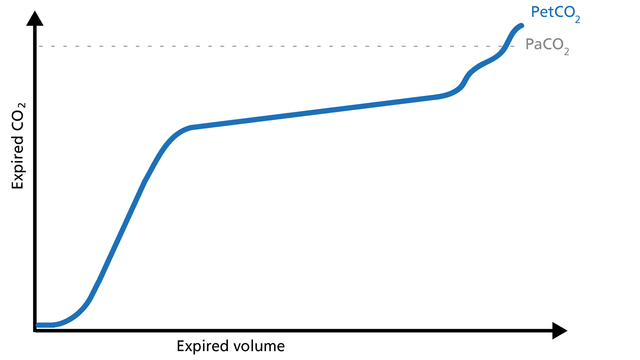
Concave Phase III volumetric capnograms have been seen with obese patients and patients with increased expiratory resistance. Obese patients (Figure 4) can have biphasic emptying and higher PetCO2 than PaCO2. That difference suggests varying mechanical and ventilation/perfusion properties. The increase in expiratory resistance (Figure 5) may reflect a slow expiratory phase with a slow accumulation of alveolar CO2. The alveoli that empty last may have more time for CO2 diffusion.

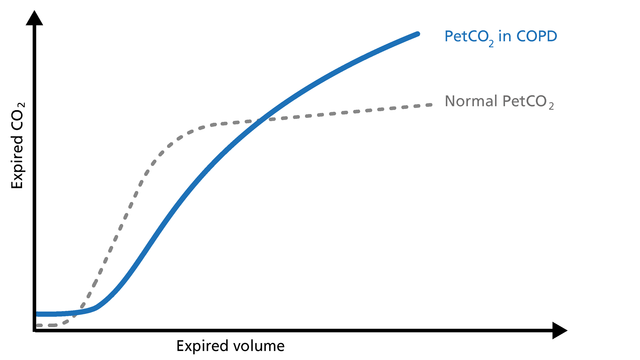
When spirometry cannot be performed reliably, volumetric capnography can be used as an alternative test to evaluate the degree of functional involvement in obstructive lung disease patients (COPD, asthma, cystic fibrosis, etc.). Obstructive lung disease is characterized by asynchronous emptying of compartments with different ventilation/perfusion ratios (Figure 6).
Patients with high airway resistance demonstrate a decrease in the Phase II slope and a steep slope in Phase III. The volumetric capnogram can give you insights into therapy efficiency (Figure 7).
Good to know: The volumetric capnogram in COPD patients shows a prolonged Phase II, an increase in PetCO2, and a continuously ascending slope without a plateau in Phase III (Figure 6).
A Phase II shift to the left indicates reduced resistance. The slope of Phase III shows a decrease in steepness indicating better gas distribution and reduced alveolar dead space (VDalv) (Figure 7).

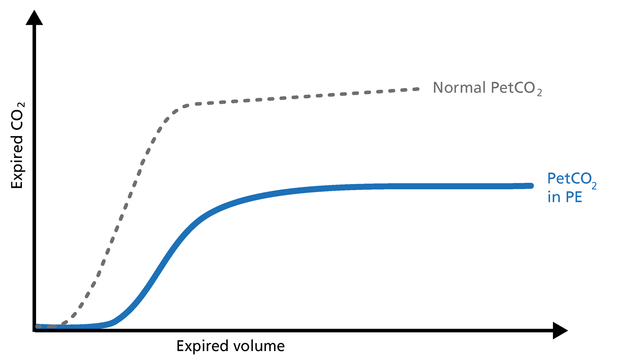
Pulmonary embolism (PE) leads to an abnormal alveolar dead space that is expired in synchrony with gas from normally perfused alveoli. This feature of PE separates it from pulmonary diseases affecting the airway, which are characterized by nonsynchronous emptying of compartments with an uneven ventilation/perfusion relationship. In the case of sudden pulmonary embolism, volumetric capnography has a typical unique shape (Figure 8).
Good to know: In patients with sudden pulmonary vascular occlusion due to pulmonary embolism, Phase I is increased due to increased anatomical dead space. The slope of Phase II is decreased due to poor lung perfusion. Phase III has a normal plateau with low PetCO2 because the number of functional alveoli is reduced. In this case, V‘CO2 drops suddenly.
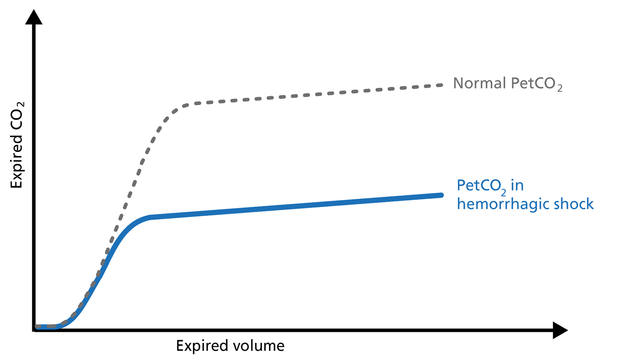
Hemorrhagic shock is a condition of reduced tissue perfusion, resulting in the inadequate delivery of oxygen and nutrients that are necessary for cellular function (Figure 9).
Good to know: The expired CO2 drops drastically. Phase I is unchanged and the slopes of Phase II and III are unchanged, but PetCO2 is decreased due to the increase in alveolar dead space.
The volumetric capnogram and trends show the patient‘s response to the weaning trial and allow for better management of the weaning process.
Indications for a successful weaning trial are:
Indications for an unsuccessful weaning trial are:
If arterial access is not something you routinely perform when you transport a ventilated patient, PetCO2 can be used for monitoring perfusion and ventilation during transport.
Good to know: A decrease in PetCO2 accompanied by a decrease of VCO2 can signify:
An elevation of the baseline during Phase I indicates rebreathing of CO2, which may be due to mechanical problems or therapeutic use of mechanical dead space (Figure 10).
Good to know: In this case, consider recalibrating the CO2 sensor or reducing the airway accessories.

All Hamilton Medical ventilators offer volumetric capnography (
Full citations below: (
Learn how to interpret a volumetric capnogram and get an overview of the benefits and clinical applications of volumetric capnography. Includes a self-test!

A single breath curve in volumetric capnography exhibits three characteristic phases of changing gas mixtures. Learn more about anatomical dead space, the transition phase, and the plateau phase.

Anatomical dead space, alveolar dead space, and CO2 elimination: Learn how they can give you an insight into the patient's lung condition.

Rising and falling trends for PetCO2 and V’CO2 help identify potential changes in the patient’s condition. Learn about the clinical application of trends.